Data quality note
From July 2019 onwards, data in this publication has been sourced from the Economic and Financial Statistics (EFS) collection, a new and improved data source. There have been extensive and ongoing discussions with lenders about the EFS collection, however only four reporting periods have been collected on the new basis for this first issue of Lending Indicators. Data quality is therefore expected to continue to improve over time, as lenders become accustomed to the new reporting basis and further refine the data they report. This process is likely to lead to revisions, including to the historical time series.
Backcasted data to July 2002 is included for some data series. The historical time series data, prior to July 2019, should be used with caution, particularly lower level series that are more volatile. Data prior to July 2019 has been modelled using comparisons made during July 2019 to September 2019, when the new EFS collection was conducted in parallel with the old collection. Consequently, the historical time series should be viewed as analytical series provided to help with interpretation of data reported on the new EFS basis.
Lender type breakdowns
Lender type breakdowns for Major banks, Other Authorised Deposit-taking Institutions (ADIs) and Non-ADIs are only available in this publication for July 2019 to October 2019. It is likely that more information about lender-type breakdowns will become available in the coming months.
Key statistics
In October 2019, new loan commitments:
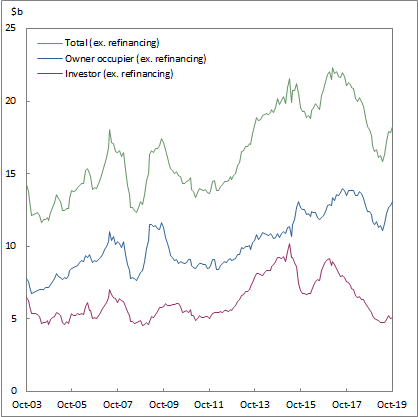
- rose 2.0% for housing (seasonally adjusted)
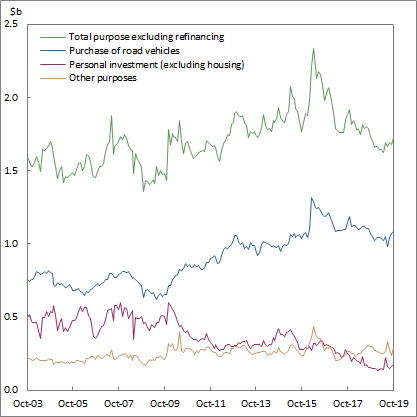
- rose 3.1% for personal fixed term loans (seasonally adjusted)
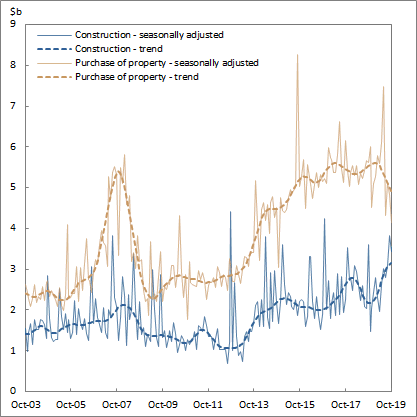
- rose 1.2% for business construction (trend)
|
| New loan commitments | October 2019 | Month percent change | Year percent change |
 |  |  | $b | % | % |
Seasonally adjusted |
|
| Households |  |  |  |
 | Housing | 18.21 | 2.0 | 0.9 |
 |  | Owner occupier (a) | 13.11 | 2.2 | 5.7 |
 |  | Investor (a) | 5.10 | 1.4 | -9.7 |
 | Personal | | | |
 |  | Fixed term loans | 1.73 | 3.1 | -0.4 |
| Businesses | | | |
 | Construction | 3.44 | -10.1 | -4.3 |
 | Purchase of property | 4.15 | -14.0 | -26.1 |
Trend |
|
| Households |  |  |  |
 | Housing | 18.08 | 1.6 | 0.8 |
 |  | Owner occupier (a) | 13.00 | 1.9 | 5.9 |
 |  | Investor (a) | 5.08 | 0.9 | -10.3 |
 | Personal | | | |
 |  | Fixed term loans | 1.72 | 1.0 | -1.2 |
| Businesses | | | |
 | Construction | 3.14 | 1.2 | 44.0 |
 | Purchase of property | 4.92 | -2.2 | -10.9 |
|
| (a) Loan commitments for owner occupier and investor housing exclude refinancing. |
Key graphs
The value of commitments rose during October but levels remain below the peak in March 2017
New loan commitments, total housing (seasonally adjusted), values, Australia
 In October, personal fixed term loans rose to the highest level of 2019
New loan commitments, personal fixed term loans (seasonally adjusted), values, Australia
 The value of business finance commitments for construction and purchase of property have continued to converge over the past year in trend terms
New loan commitments, business finance by purpose, values, Australia

 Print Page
 Print All
 Quality Declaration