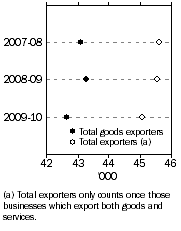
Key Figures
 |  | 2007-08 | 2008-09 | 2009-10 | 2008-09
to
2009-10
% change |
|
| Number of Exporters (No.) |  |  |  |  |
 | Total goods exporters | 43 098 | 43 259 | 42 652 | -1.4 |
 | Total services exporters | 3 558 | 3 400 | 3 613 | 6.3 |
 | Total exporters(a) | 45 604 | 45 559 | 45 057 | -1.1 |
| Value of Exports ($m) |  |  |  |  |
 | Total goods exports | 180 857 | 230 829 | 200 720 | -13.0 |
 | Total services exports | 50 028 | 52 619 | 52 017 | -1.1 |
 | Total value of exports | 230 885 | 283 448 | 252 737 | -10.8 |
|
| (a) Total exporters only counts once those businesses which export both goods and services. |
Total Number of Exporters

|  |
Key Points
KEY POINTS
- The total number of exporters of goods and services decreased in 2009-10 to 45,057, a decrease of 1% from 2008-09 (45,559).
- Less than 1% (241) of the total number of goods exporters had a total value of exports worth '$100m or more'. This is a decrease from 2008-09 by 15 exporters (6%). In 2009-10, these exporters contributed $164b (82%) by value to total goods exports.
- 1% (33) of the total number of services exporters had a total value of services exports worth '$100m or more'. These exporters contributed 16% of the total value of services exports.
- 68% (28,816) of the total number of goods exporters had a total value of exports less than $100,000, contributing $660m (less than 1%) of the total value of goods exports.
- There were 536 goods exporters in the Mining industry. Although these business represented 1% of the total number of goods exporters, they contributed $97b (48%) of the total value of goods exports.
- There were 12,027 goods exporters in the Wholesale trade industry. Although these businesses represented 28% of the total number of goods exporters, they contributed $24b (12%) of the total value of goods exports.
- The total value of Travel services exports was $33b (63%) of total services exports.
NOTES
ABOUT THIS ISSUE
This publication presents an analysis of the characteristics and international trading activities of Australian exporters in 2009-10. The information is compiled as a by-product of producing regular monthly and quarterly statistics on Australia's merchandise trade and international trade in services. The first table presents an overview covering exporters of both goods and services. Tables 2 to 9 present more detailed information on goods exporters and Table 10 presents additional information on services exporters. These tables are available for free from the "Downloads" tab of this publication on the ABS website.
INQUIRIES
For further information about these and related statistics, contact Andrew Gibbs on Canberra (02) 6252 5409.
 Print Page
 Print All