JUNE KEY FIGURES
 |  | Credit market outstandings at end | Demand for credit during | Other changes during | Credit market outstandings at end |
 |  | Mar Qtr 2005 | Jun Qtr 2005 | Jun Qtr 2005 | Jun Qtr 2005 |
 |  | $b | $b | $b | $b |
|
| Non-financial corporations |  |  |  |  |
 | Private | 1 292.3 | -48.1 | -4.5 | 1 239.8 |
 | National public | 46.0 | -0.4 | -0.3 | 45.3 |
 | State and local public | 40.0 | 2.9 | 0.0 | 42.9 |
| General government |  |  |  |  |
 | National | 59.1 | 0.1 | 0.4 | 59.6 |
 | State and local | 35.1 | -0.2 | 0.0 | 34.9 |
| Households | 865.4 | 32.8 | 0.0 | 898.1 |
| Total | 2 337.9 | -12.9 | -4.4 | 2 320.6 |
|
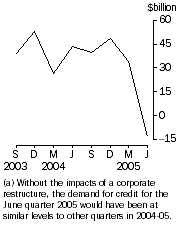
Total demand for credit(a)
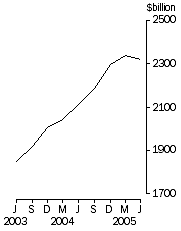
| Credit market outstandings
|
JUNE KEY POINTS
SUMMARY
- Credit market aggregates during the June 2005 quarter were dominated by the impacts of some large transactions resulting from corporate restructuring. The total demand for credit, -$12.9b, would have been +$53.9b without the restructuring impacts, up significantly from the +$34.3b recorded for March quarter 2005. Credit market outstandings were $2,320.6b at the end of the quarter.
NON-FINANCIAL CORPORATIONS
- Credit market liabilities of private non-financial corporations reduced by $52.5b. There would have been an increase of $14.3b without the corporate restructuring transactions, with +$18.7b transactions and -$4.4b valuation changes.
- National public non-financial corporations repaid a net $0.4b, and State and local public non-financial corporations raised $2.9b.
GENERAL GOVERNMENT
- National general government repaid a net $0.4b. State and local general government repaid a net $0.2b.
HOUSEHOLDS
- Households raised a net $32.8b during the June quarter 2005, up sharply from the $20.5b raised during the March quarter 2005. Households borrowed $23.1b from banks (of which $12.5b was for owner-occupied housing and $5.4b for investment housing) up $13.8b from the previous quarter.
NOTES
CHANGES TO THIS ISSUE
There are no changes in this issue.
SIGNIFICANT EVENTS
A large corporate group restructured during the quarter by transferring its Australian subsidiaries to the Rest of the World. The transfers have been treated as transactions in these statistics, in accordance with treatments of similar restructurings in the past. The treatment is also consistent with the treatment in the balance of payments and international investment position statistics.
A large takeover transaction was completed during the quarter which has had the effect of removing a significant amount of listed equity from aggregates through consolidation of intra-sector holdings.
REVISIONS IN THIS ISSUE
There have been significant revisions to previously published aggregates through:
- application of 16 quarters' revisions in the International Investment Survey. The principal impacts are on equity series by application of improved approximations to market valuations. See also page 2 of Balance of Payments and International Investment Position (ABS cat. no. 5302.0) June quarter 2005;
- incorporation of results of the new APRA quarterly survey of superannuation funds. Evaluation of the results of the December quarter 2004 APRA survey, with the ABS survey conducted in parallel, and evaluation of the methods for estimating totals from survey and administrative data support the conclusion that there had been undercoverage of superannuation funds placed with fee-for-service fund managers in the previous ABS survey, which the APRA survey replaced, back to December 2001. Accordingly, these statistics include revised estimates back to December 2001;
- other revisions have resulted from standard quality assurance activities, and have been applied 16 quarters (back to June 2001);
- because of the number and size of the revisions outlined above, there has been significant impacts on residually derived series, principally in holdings of securities by households.
NOTE FOR AUSSTATS SPREADSHEET USERS
As a result of the revisions and restructures, there are a number of new time series (new rows of data) in spreadsheets. Care should be taken with comparing current and previous versions of spreadsheets or running data extraction macros.
INQUIRIES
For further information about these and related statistics, contact the National Information and Referral Service on 1300 135 070 or Derick Cullen on Canberra (02) 6252 6244.
ANALYSIS AND COMMENTS SECTORAL SUMMARY
INTERSECTORAL FINANCIAL FLOWS
During June Quarter 2005
Significant flows during the June quarter 2005 were the net $8.0b borrowed by non-financial corporations from rest of world and a net $12.5b borrowed by non-financial corporations from financial corporations. Financial corporations borrowed a net $0.5b from rest of the world and received a net $3.2b from households.
During Year 2004-2005
Significant flows during the year ended June 2005 were the net $24.6b borrowed by households from financial corporations, the net $29.4b borrowed by financial corporations from rest of world, the net $20.4b raised by non-financial corporations from financial corporations, and the net $11.9b repaid by general government to financial corporations.
ANALYSIS AND COMMENTS MARKET SUMMARY
FINANCIAL MARKET ANALYSIS
Selected Financial Instruments |
|  |
 | Outstanding at end | Trans- actions during | Other changes during | Outstanding at end |  |
 | Mar Qtr 2005 | Jun Qtr 2005 | Jun Qtr 2005 | Jun Qtr 2005 |  |
| Selected Financial Instruments | $b | $b | $b | $b |  |
|  |
| Currency and deposits | 817.6 | 33.2 | 0.2 | 851.0 |  |
| Short term debt securities | 363.7 | -0.8 | -0.6 | 362.2 |  |
| Long term debt securities | 682.1 | 24.1 | 4.1 | 710.3 |  |
| Derivatives | 147.3 | -17.0 | 14.7 | 145.1 |  |
| Loans and placements | 1 812.5 | 62.4 | 1.3 | 1 876.2 |  |
| Listed shares | 963.6 | -1.2 | 20.2 | 982.6 |  |
| Unlisted shares | 1 035.1 | -132.7 | -4.9 | 897.4 |  |
| Reserves of life offices and pension funds | 741.0 | 21.1 | 15.8 | 777.9 |  |
| General insurance prepayments and reserves | 60.0 | 1.2 | 0.0 | 61.2 |  |
|  |
Deposit liabilities increased to $851.0b at the end of June 2005, following transactions of $33.2b during the quarter, compared with transactions of $4.9b in the previous quarter. Banks accepted $14.9b (up $10.4b), rest of world accepted $11.0b (up $13.9b) and other depository corporations accepted $6.9b (up $1.7b).
Short term security liabilities decreased to $362.3b at the end of June 2005.
Total bond liabilities increased to $710.3b at the end of June 2005, following issues of $24.1b during the quarter. Banks issued $14.7b, of which $3.3b was issued offshore and $11.4b was issued domestically. Financial intermediaries n.e.c. (mainly securitisation vehicles) issued $5.4b, of which $4.5b was issued domestically and $0.9b was issued offshore. Net issues in the Australian market by non-residents was $2.1b (up $1.8b).
The value of derivative contracts on issue at the end of June 2005 decreased by $2.2b to $145.1b. Components of the decrease were net settlements of $17.0b and valuation increases of $14.8b.
Loan liabilities rose to $1,876.2b at the end of June 2005 following transactions of $62.4b during the quarter. Borrowing by households was $31.9b, while private non-financial corporation borrowed $12.9b and pension funds borrowed $12.2b.
The listed share market increased by $19.0b to $982.6b at the end of June 2005, with reductions of $1.2b and valuation increases of $20.2b. Financial intermediaries n.e.c had issues of $1.9b and Private non-financial corporations had reductions of $3.9b, following completion of takeover activities.
The value of the unlisted share market decreased by $137.7b to $897.3b at the end of June 2005, due to restructuring of a large corporate group. Without the impact of the restructuring, net transactions would have been $0.9b.
At the end of June 2005, the reserves of life offices and pension funds were $777.9b following transactions during the quarter of $21.1b and valuation increases of $15.8b. General insurance prepayments and reserves were $61.2b.
SECTORAL ANALYSIS
NON-FINANCIAL CORPORATIONS
Summary
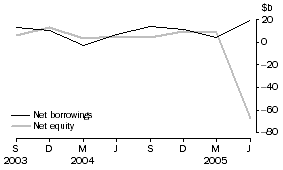
Private non-financial corporations reduced liabilities a net $46.4b (excluding derivatives and accounts payable) during the June quarter 2005. They borrowed $13.4b in loans and made a net issue of $5.6b in debt securities. Share issues fell a net $67.1b during the quarter following a large corporate restructure. These transactions resulted in total borrowings outstanding of $486.6b and total equity on issue of $753.1b.
PRIVATE NON-FINANCIAL CORPORATIONS, NET ISSUE OF EQUITY AND BORROWINGS
During the June quarter 2005, total liabilities of national public non-financial corporations decreased by $0.5b following decreases in transactions of $0.2b and valuation decreases of $0.3b. Redemption of debt securities was $0.4b and there was no issue of listed shares and other equity. Liabilities of state and local public non-financial corporations decreased by $0.4b to $144.1b.
Private non-financial corporations debt to equity ratio
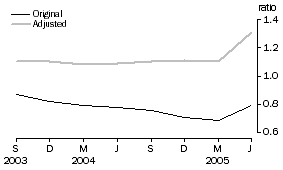
From the end of June 2003 to the end of June 2005 the value of equity on issue increased by $187.1b. The value of debt outstanding rose $74.1b during the period. During the quarter, private non-financial corporation debt increased by $22.0b, while equities on issue decreased by $73.1b. Over the June quarter 2005, the original debt to equity ratio rose from 0.69 to 79.0 and the adjusted ratio rose from 1.10 to 1.31. The adjusted ratio reflects the removal of price change from the original series. The movement in the ratio includes some one-off effects of corporate restructuring.
DEBT TO EQUITY RATIO - JUNE 1995 BASE
FINANCIAL CORPORATIONS
Summary
During the June quarter 2005, financial corporations issued $49.9b liabilities on a consolidated basis. Issuers of liabilities were: banks, $25.9b; pension funds, $20.3b; financial intermediaries n.e.c., $11.0b; life insurance corporations, $2.2b; other depository corporations, $1.4b; other insurance corporations, $0.9b; and the Reserve Bank, $0.7b. Central borrowing authorities were the only redeemers of liabilities, $2.0b.
Banks
During the quarter, transactions of banks’ currency and deposits liabilities were $16.4b. They had issuance in loans and placements of $0.5b and bonds, $14.0b. These were offset by redemptions of one name paper of $0.3b, net settlements of derivatives in a liabilities position of $6.2, and other accounts payable of $0.5b.
Transactions of financial assets of banks were $28.6b during the quarter. Banks loaned a net $32.4b, of which loans to households were $23.1b and private non-financial corporations were $7.5b. These loans were offset by repayments of $0.7b by financial intermedieries nec. Transactions in bank holdings were: bills of exchange, $3.1b; and bonds $2.6b. These were offset by redemptions of one name paper of $0.8b, net settlements of derivatives in an asset position of $7.7m, equities of $0.8b and net reductions of currency and deposits of $0.5b.
Other depository corporations
Funding of other depository corporations increased by $1.4b during the June quarter 2005, driven mainly by an increase in currency and deposits of $6.7b partially offset by net settlements of derivatives in a net liability position of $3.1b. Net transactions in financial assets were $5.9b, with the main contributor being loans and placements with an increase of $6.6b. This increase was offset by net settlements of derivatives in a net liability position of $3.0b.
Life insurance corporations
At the end of June quarter 2005, the financial assets of life insurance corporations stood at $211.8b, an increase of $4.6b from the previous quarter with net transactions of $2.0b and valuation increases of $2.6b. During the quarter there were increases to currency and deposits of $1.8b, net purchases of bonds of $0.5b, equities sales of $0.4b and accounts receivable by $0.1b. There were decreases to loans and placements of $0.1b while one name paper and bills remained the same. Pension fund claims against the reserves of life offices increased by $5.6b following net transactions of $1.8b and valuation increases of $3.8b. Households claims against the reserves of life offices increased by $2.2b following net transactions of $0.9b and valuation increases of $1.3b.
Pension funds
Net equity in reserves of pension funds was $730.8b at the end of the June quarter 2005, an increase of $34.8b, following net transactions of $20.2b and $14.6b valuation increases during the quarter. All asset classes experienced increases during the quarter, with pension funds transactions in other accounts receivable of $6.5b, long term debt securities of $4.0b, currency and deposits of $3.6b, transactions in equities of $2.8b, net equities in life office reserves of $1.8b, loans and placements of $1.0b and holdings of short term debt securities of $0.6b.
Other insurance corporations
During the June quarter 2005, net liability transactions of other insurance corporations were $0.9b, of which the main contributors were prepayments of premiums and reserves of $1.2b, partially offset by a decrease in other accounts payable of $0.9b. Net transactions in financial assets of other insurance corporations were $0.8b during the June quarter, contributed mainly by increases in one name paper of $0.6b and other accounts receivable of $0.6b..
Central borrowing authorities
Total liabilities of central borrowing authorities was $111.6b at the end of the June quarter 2005. During the quarter, the authorities had a net redemption in one name paper of $0.3b, a net redemption in bonds of $0.2b and a decrease in loans and placements liabilities of $0.3b.
Financial intermediaries n.e.c.
Net liability transactions of financial intermediaries n.e.c. were $11.0b during the quarter, mainly through a a net issue of listed shares and equity of $2.9b, net issue of bonds of $2.5b and a net issue of one name paper of $2.0b. During the quarter financial assets increased by $10.2b, mainly through loans and placement to households of $6.2b.
Net flow of currency and deposits to banks
Transaction in currency and deposit liabilities of banks during the June quarter 2005 were $16.4b. The transactions in currency and deposit assets of pension funds were $3.5b, households, $6.5b, other depository corporations, $1.3b, financial intermediaries nec, $1.0 and private non-financial corporations $7.4b. These were offset by a reduction in bank deposits by the rest of the world $4.7b.
CURRENCY AND DEPOSITS LIABILITIES, BANKS
Asset portfolio of life insurance corporations and pension funds at end of quarter
At the end of June quarter 2005 life insurance corporations held $124.3b in shares and other equity (59% of their financial assets), of which $103.6b was in resident companies and $20.7b was in non-resident companies; $47.4b in bonds (22% of their financial assets), of which $41.7b was in Australian bonds and $5.7b in non-resident bonds; and $18.9b in short term securities (9% of their financial assets).
At the end of June quarter 2005 pension funds held $364.1b in shares and other equity (51% of their financial assets), of which $264.3b was in resident companies and $99.8b was in non-resident companies. They held $147.6b of net equity in life office reserves (21% of their financial assets); and $73.4b in bonds (10% of their financial assets), of which $36.2b were Australian bonds and $37.2b were non-resident bonds.
Financial claims between households, life insurance companies, pension funds and investment managers at end of quarter
At the end of June quarter 2005 households had claims against the reserves of life insurance corporations of $47.2b and pension funds of $730.8b. Pension funds had claims against the reserves of life insurance corporations of $147.6b. Life insurance corporations invested $140.5b of their financial assets through investment managers and pension funds invested $315.2b through investment managers. Note that the pension fund investment through fund manager series has been revised upwards back to December 2001.
Asset portfolio of other insurance corporations at end of quarter
The graph below shows that at the end of June quarter 2005 other insurance corporations held $28.6b in shares and other equity (30% of total financial assets), of which $23.1b was in resident corporations. Other insurance corporations also held $27.4b in bonds (28% of total financial assets), of which $25.7b was issued by resident corporations and $1.7b by non-resident corporations.
Central borrowing authorities net issue of debt securities
Central borrowing authorities had net redemption of bonds of $0.2b and net redemption of one name paper of $0.3b in the June quarter 2005
Financial intermediaries n.e.c. net issue of debt securities
During the June quarter 2005 financial intermediaries n.e.c. made a net issue of bonds of $2.5b and a net issue of short term paper of $2.0b.
GENERAL GOVERNMENT
Summary
During the June quarter 2005, consolidated general government transactions resulted in a net change in financial position of -$2.8b (see table 33, June quarter 2005). The liability transactions of national general government during the June quarter were $3.9b. Main contributors were a $3.3b change in balances for accounts payable and a $0.9b rise in unfunded superannuation claims. During the June quarter, asset transactions were -$0.5b. Main contributors were a -$1.1b change in balances for accounts receivable, net settlements of derivatives in a net asset position of $0.4b, and $1.3b increase in outstanding loans by households. The net change in financial position for national general government during the June 2005 quarter was -$4.3b. At the end of June 2005, national general government had total liabilities of $181.7b and total financial assets of $96.1b.
Transactions in state and local general government financial assets were $1.5b in the June quarter 2005, while transactions in total liabilities were $0.1b, resulting in a change in financial position of $1.5b. At the end of the quarter, state and local general government had total liabilities of $97.5b and total financial assets of $139.2b.
Change in financial position
National government issue of debt securities
The accompanying graph illustrates the national general government’s bond issuance. The net issue of treasury bonds was $0.2b during the quarter.
HOUSEHOLDS
Summary
Households change in financial position was -$2.3b during the quarter. Borrowing mainly through bank loans was $33.0b. This was largely offset by financing and acquisition of 30.7b mainly in the form of net contribution to pension funds.
Households purchased a net $1.4b in equities during the June quarter 2005, the major contributors being the purchase of $1.7b of bank shares, $1.5b of financial intermediaries n.e.c shares and $0.5b of life insurance corporation shares. These were offset by the $1.1b sale of private non-financial corporation shares and the $0.5b sale of national public non-financial corporation shares.
At the close of the quarter, households' stock of financial assets was $1,703.1b. This was up $53.7b from the revised previous quarter number, following net transactions of $30.7b and valuation increases of $23.0b. Major asset holdings were net equity in reserves of life insurance corporations and pension funds of $777.9b, currency and deposits of $377.4b, equities of $313.4b, and unfunded superannuation claims of $147.7b.
Household net borrowing and debt to liquid asset ratio
Of the net $31.9b borrowed by households, bank loans accounted for $23.1b. Of the bank loans, $12.5b was borrowed for owner occupied housing up $8.9b from the revised March quarter figure, and $5.4b for investment housing up $3.2b from the revised March quarter figure. There was an increase of $6.2b in borrowing from financial intermediaries nec.
The graph below illustrates that the debt to liquid assets ratio at the end of June 2005 was at 125.7%, an increase of 1.7 percentage points from the revised March quarter ratio. The ratio was influenced by an overall increase from the previous quarter of 3.8 percentage points in total outstanding household borrowings while total liquid assets only rose 2.4 percentage points (of which the major contributors were deposits and equities)..
Insurance and pension claims
During the June quarter 2005 households' net equity in reserves of pension funds increased $34.8b, made up of $20.2b net contributions and $14.6b valuation increases, bringing household net equity in pension funds to $730.8b. Net equity in reserves of life insurance corporations increased $2.2b, made up of a $0.9b net purchase and a $1.3b valuation increase, bringing the household net equity in life insurance to $47.2b. Net transaction in households' unfunded superannuation claims were $1.1b during the quarter. Prepayments of premiums and claims against reserves in general insurance corporations increased $0.6b.
REST OF THE WORLD
Summary
Non-residents invested a net $11.6b in Australian financial assets during the June quarter 2005.
The value of Australian financial assets held by non-residents at the end of the quarter was down $50.3b from the March quarter, including $1.7b valuation increases. There were reduced holdings of equity by $62.7b, reductions in placements of currency and deposits of $3.2b, loans of $0.4b, accounts receivable of $1.2b, and net settlements of derivatives in an asset position of $4.0b. These were offset partially by the increases in holding of bills of exchange of 1.2b, purchases of one name paper of $3.3b and purchases of bonds of $15.3b (of which $12.4b was issued by banks).
Australian residents sold foreign financial assets worth net $63.5b during the June quarter 2005. The total value of foreign assets held by Australian residents fell to $621.7b at the end of the quarter, after taking into account a valuation increase of $11.1b. Residents had a settlement of derivatives in a net asset position of $5.0b, a decrease in accounts receivable of $0.7b, and a reduction in purchases of equity of $73.3b. These were partially offset by residents' purchases of debt securities of $1.0b from non-residents, and placements of currency and deposits of $11.0b and loans and placements of $3.4b with non-residents.
Net purchases of equities
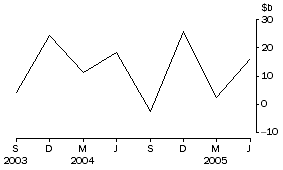
The accompanying graph shows that during the June quarter 2005 non-residents sold a net $62.7b in equities, a reduction of $70.9b compared with the March quarter 2005. Net purchases would have been $4.1b if the impact of restructuring of a large corporate group is set aside.
Net purchases of bonds
The accompanying graph shows that non-residents purchased $15.3b of Australian bonds during the June quarter 2005, a decrease of $4.8b compared with the March quarter 2005.
 Print Page
 Print All