MARCH KEY FIGURES
 |  | % change Dec qtr 03 to Mar qtr 04 | % change Mar qtr 03 to Mar qtr 04 |
|
| GDP (Chain volume measure) |  |  |
 | Trend | 0.8 | 3.7 |
 | Seasonally adjusted | 0.2 | 3.2 |
| Final consumption expenditure (Chain volume measure) |  |  |
 | Trend | 1.3 | 5.3 |
 | Seasonally adjusted | 1.0 | 5.3 |
| Gross fixed capital formation (Chain volume measure) |  |  |
 | Trend | 1.1 | 6.8 |
 | Seasonally adjusted | -2.1 | 4.8 |
| GDP chain price index |  |  |
 | Original | 1.4 | 2.6 |
| Terms of trade |  |  |
 | Seasonally adjusted | 3.8 | 9.9 |
| Real net national disposable income |  |  |
 | Trend | 1.8 | 6.0 |
 | Seasonally adjusted | 1.4 | 5.6 |
|
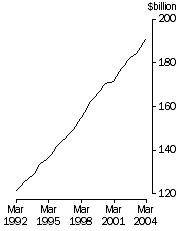
GDP - Trend, Chain Volume Measure

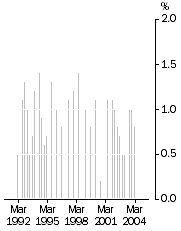
| GDP - Trend, Chain Volume Measure, qtly change

|
MARCH KEY POINTS
TREND ESTIMATES
- In volume terms GDP increased by 0.8% in the March quarter. GDP per capita grew by 0.5%, GDP per hour worked in the market sector grew by 0.7% and real net national disposable income grew by 1.8%.
SEASONALLY ADJUSTED ESTIMATES
- In volume terms GDP increased by 0.2% in the March quarter. Non-farm GDP growth was flat while farm GDP rose by 5.9%. Continued strong growth in the terms of trade is being reflected in strong growth in real net national disposable income of 1.4% in the March quarter and 5.6% since March quarter 2003.
- On the expenditure side the increase in GDP was driven by growth in household final consumption expenditure (+0.8 percentage points) and private non-farm inventories (+1.1 percentage points). These were offset by negative contributions from net exports (-1.4 percentage points) and gross fixed capital formation (-0.6 percentage points).
- On the production side there were small positive contributions from most industries, with four industries (mining, construction, property and business services and cultural and recreational services) detracting from GDP growth.
NOTES
FEATURE ARTICLES
Two feature articles have been included in this issue. 'Supply and use tables and the quarterly national accounts' starts on page 14 and 'Measuring price change in the Australian economy' starts on page 20.
REVISIONS
Revisions have been made to a number of aggregates. Their net effect on the December quarter 2003 estimate of seasonally adjusted GDP (in chain volume terms) has been to lower quarterly growth by 0.1 percentage points.
In the compilation of the March quarter accounts, more up-to-date source data has been included that has revised estimates. In particular, updated government finance statistics for 2002-03 have been incorporated in the estimates of government final consumption expenditure. In addition, a number of series have been seasonally reanalysed. These included household consumption on food, cigarettes and tobacco, motor vehicle purchases, most components of private and public capital formation and private non-financial corporations gross operating surplus.
NATIONAL ACCOUNTS QUARTERLY PRESENTATIONS
The National Accounts Branch runs a series of presentations in each ABS state and territory office following the release of the quarterly national accounts. The presentations cover movements in GDP and its components and specific state detail.
For more information, including contact details, please refer to the National Accounts theme page on the ABS web site <https://www.abs.gov.au>.
CHANGES IN NEXT ISSUE
There are two changes to the chain volume estimates that will be incorporated in the June quarter 2004 release. First, a new base year, 2002-03, will be introduced into the chain volume estimates and this will lead to revisions to growth rates in periods after 2002-03. Second, the chain volume estimates will be re-referenced to 2002-03 thereby preserving additivity in the quarters after the reference year. Re-referencing affects the levels of, but not the movements in, chain volume estimates.
INQUIRIES
For further information contact Michael Anderson on Canberra 02 6252 6713 for income & consumption estimates, and Patricia Mahony on Canberra 02 6252 6711 for investment, trade & industry estimates.
 Print Page
 Print All