Note: Further tables are available from the Children's Participation in Cultural and Leisure Activities, Australia (cat no. 4901.0) providing additional data on children's participation in sport and recreational activities on a state and territory level under the Category of Data Cubes.
NOTES
ABOUT THIS PUBLICATION
This publication presents results from the Survey of Children's Participation in Cultural and Leisure Activities conducted in April 2006. While the publication primarily provides information about the participation of children aged 5 to 14 years in cultural, sporting and other leisure activities, details on children's use of computers and the Internet and their involvement in homework and other study are also presented.
ABOUT THIS SURVEY
The 2006 Survey of Children's Participation in Cultural and Leisure Activities was conducted throughout Australia as part of the Australian Bureau of Statistics' (ABS) Monthly Population Survey (MPS). This survey is the third on the topic of children's participation in culture and leisure, the previous two being conducted in April 2000 and April 2003.
As with previous iterations, the 2006 survey collected information on children's participation in selected organised cultural activities and organised sports outside of school hours during the 12 months prior to interview. The survey also collected data on use of computers and the Internet during and outside school hours over the same 12 month period. Similar to earlier surveys, information was also collected on participation in selected leisure activities (such as skateboarding or rollerblading, and watching television, videos or DVDs) outside of school hours during the most recent two school weeks prior to interview.
New to the 2006 survey were questions about children's attendance at selected cultural venues and events outside school hours and their involvement in homework and other study. Details were collected on the characteristics of children who participated and on the frequency and duration of their involvement in some activities.
ROUNDING
As estimates have been rounded, discrepancies may occur between sums of the component items and totals.
INQUIRIES
For further information about these and related statistics, contact the National Information and Referral Service on 1300 135 070 or Mike Stratton on Adelaide (08) 8237 7399.
SUMMARY COMMENTARY
INTRODUCTION
In the 12 months to April 2006 there were approximately 2,664,700 children aged 5 to 14 years in Australia within the scope of the survey (see Explanatory Notes). An estimated 63% (1,691,100 children) had played a sport outside of school hours which had been organised by a school, club or association. During the same period, 33% (869,600) of children were involved in at least one of four selected cultural activities (playing a musical instrument, singing, dancing and drama) in their non school hours. An estimated 27% (716,400) of children did not take part in either organised sport or any of the selected cultural activities outside of school hours during the 12 month period.
This information was obtained from an Australian Bureau of Statistics (ABS) survey which asked mainly parents and guardians about their children's involvement in a range of cultural, sporting and other, mainly leisure, activities outside of school hours. While cultural and sporting activities related to the previous 12 months, the other activities were in relation to involvement outside of school hours in the most recent two school weeks.
The survey collected information on a range of activities selected to give an indication of what children did outside of school hours. As the popular belief is that watching television and playing computer games dominates children's lives, these activities were an obvious inclusion in the survey. Bike riding, rollerblading and skateboarding were added to get some indication of children's involvement in informal physical activity. Similarly, involvement in art and craft was included to give some understanding of children's informal involvement in cultural activities. Reading for pleasure and homework or other study were also included. Involvement in these activities over a two week period ranged from 24% (627,800) of children for skateboarding and rollerblading to 97% (2,596,000) of children who watched television, videos or DVDs. During the two weeks, 83% (2,209,100) did homework or other study outside of school hours.
The survey also collected information on attendance at cultural venues and events and computer and Internet use. It found that 71% of children (1,879,700) had attended, outside of school hours, a public library; a museum or art gallery; or a performing arts event, at least once in the 12 months to April 2006. During this period 92% (2,463,300) of children had also used a computer with 65% (1,730,700) having accessed the Internet either during or outside of school hours.
CHANGES IN PARTICIPATION SINCE 2000
Surveys of children's participation in culture and leisure activities have been conducted previously by the ABS in 2000 and 2003. A comparison of the data from 2000 to 2006 shows marginal increases in participation in both organised sport (from 59% in 2000 to 63% in 2006) and the four selected cultural activities (from 29% to 33%). The higher sport participation rate is a result of increased involvement by both girls and boys. Over the six year period girls' participation in organised sport rose 6 percentage points from 52% to 58% compared with 3 percentage points from 66% to 69% for boys.
For the combined selected cultural activities, after no change to participation rates between 2000 and 2003, there was a 3 percentage point increase reported for 2006 (from 30% to 33%). This was largely due to a 5 percentage point increase between 2003 and 2006 in boys' participation (from 17% to 22%). Playing a musical instrument showed the largest increase (from 13% to 18%) between 2003 and 2006.
There was little change in participation in any of the selected other activities. The most noticeable was playing electronic or computer games which fell 7 percentage points between 2003 and 2006 from 71% to 64%. This was also below the participation rate of 69% for this activity in 2000.
In contrast, bike riding increased in 2006 to 68% from 62% in 2003. This increase was due to a 9 percentage point increase in participation by girls and a 3 percentage point increase by boys.
In 2000 and 2003, 95% of children aged 5 to 14 years used a computer during or outside of school hours. For 2006 this figure fell slightly to 92%. This did not affect the percentage of children accessing the Internet which, after increasing significantly between 2000 and 2003 (from 47% to 64% of children), did not change noticeably (65% for 2006).
SELECTED ORGANISED CULTURAL ACTIVITIES
Participation
Over the 12 month period, outside of school hours:
- 520,500 (20% of 5 to 14 year olds) played a musical instrument
- 332,600 (12%) had lessons or gave a dance performance
- 147,000 (6%) had lessons or gave a singing performance
- 119,100 (4%) participated in drama.
These activities were more popular with girls than boys. Approximately 44% (572,400) of girls and 22% (297,200) of boys were involved in at least one of the selected cultural activities. However, few children were involved in more than one cultural activity. Approximately 12% (158,400) of girls and 3% (42,600) of boys took part in two or more activities. Involvement in each of the different cultural activities varied by sex. The most obvious example was dancing where 23% (300,100) of girls were involved compared with 2% (32,500) of boys. Boys were most interested in playing a musical instrument (18% or 240,000).
PARTICIPATION IN ORGANISED CULTURAL ACTIVITIES, By sex
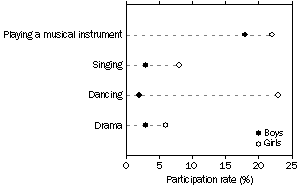
The participation rates for the combined cultural activities ranged from 38% in the Australian Capital Territory to 25% in the Northern Territory. In all states and territories, participation rates for playing a musical instrument were higher than rates for dancing which in turn were higher than singing and drama rates.
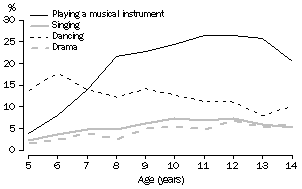
In April 2006, 18% of 5 year olds had taken part in at least one of the selected organised cultural activities during the preceding year. Overall, participation rates increased with age, peaking at 39% for those aged 10 years and then dropping to 34% for those aged 14 years. The pattern for playing a musical instrument was similar, with participation rates increasing noticeably from 5 years (4%) to 8 years (22%) of age.
PARTICIPATION IN ORGANISED CULTURAL ACTIVITIES, By age
Organised lessons
To be involved in an organised activity, a child must have performed or had formal lessons outside of school hours. The large majority of those surveyed had received lessons over the 12 month period. Approximately 93% (309,600) of children involved in dancing had taken dancing lessons; 75% (392,500) of children playing a musical instrument had taken music lessons; 70% (82,800) of children involved in drama had taken drama lessons; and 60% (87,600) of children involved in singing had taken singing lessons.
Frequency and duration
When measuring the level of involvement a child had with a cultural activity, the time spent performing, having lessons and practising were all tallied. However, practising was only included when practice sessions were set by an instructor. Of those children who played a musical instrument, 46% (238,600) did so more than 52 times during the year. Similarly, of those children participating in the activities, 25% (83,800) danced; 13% (18,800) sang; and 5% (5,500) were involved in drama more than 52 times during the year.
Those children who played a musical instrument spent an average of 6 hours over the two school weeks on this activity (including practising at home or elsewhere, having lessons or performing). Children involved in dancing spent an average of 5 hours over the two school weeks doing so. For both singing and drama, the average time spent practising, having lessons or performing was 3 hours.
ORGANISED SPORT
Participation
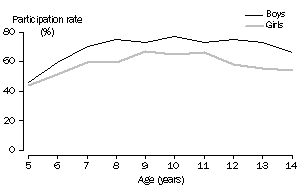
In the 12 months to April 2006 an estimated 1,691,100 (63%) children participated at least once in an organised sport outside of school hours. Participation in organised sport ranged from 45% (114,600) of children aged 5 years to 71% (190,600) of 10 year olds. While participation rates were similar for both sexes at 5 years of age (around 45%), by 7 years of age, the participation rate for boys had increased to 70% compared with 59% for girls. Boys usually had a significantly higher participation rate (69% for the combined ages) for organised sport compared with girls (58%). Just under one-third (31% or 824,900) of children played two or more organised sports during the 12 month period - 37% (500,600) for boys and 25% (324,300) for girls.
PARTICIPATION IN ORGANISED SPORT, By age
Participation rates for organised sport ranged from 71% for children in the Australian Capital Territory to 59% in Tasmania.
Sports with most participants
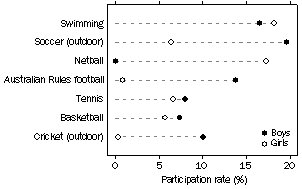
Swimming was the most popular sport for children with a participation rate of 17% (462,500), followed by outdoor soccer with 13% (351,100). For boys, the most popular sports were outdoor soccer (20% or 268,500), swimming (17% or 225,700) and Australian Rules football (14% or 188,500). For girls, the most popular sports were swimming (18% or 236,800) and netball (17% or 224,100).
PARTICIPATION IN MOST POPULAR SPORTS
Frequency and duration
For those children involved in organised sport (1,691,100), it is estimated that outside of school hours:
- on average, nearly half (49%) played or trained more than 52 times a year
- an average of 6 hours per school fortnight was spent participating
- participation ranged from an average of 4 hours per school fortnight for those aged 5 to 8 years to 7 hours for those aged 12 to 14 years.
NON PARTICIPANTS
During the 12 months prior to April 2006, 716,400 (27%) children did not participate in any of the selected organised cultural activities or organised sport outside of school hours. The level of non participation was similar for boys (26% or 360,600) and girls (27% or 355,800).
Approximately 34% (349,600) of children aged 5 to 8 years did not participate in sport or cultural activities compared with 20% (164,300) of children aged 9 to 11 years and 25% (202,500) of 12 to 14 year olds. Around 44% (48,000) of children born overseas in non English-speaking countries did not participate, compared with 26% (643,200) of children born in Australia and 27% (25,200) born overseas in English-speaking countries. Around 36% (194,500) of children in one-parent families did not participate compared with 25% (521,900) of children in couple families. Children whose parents were not employed were less likely to be involved in cultural and sporting activities (49% non participation) than those with at least one employed parent (23%).
ATTENDANCE AT CULTURAL VENUES
In the 12 months to April 2006, there were 1,879,700 (71%) children aged 5 to 14 years who attended at least one of the selected cultural venues or events. It is estimated that outside of school hours:
- 55% (1,467,500) of children visited a public library
- 37% (995,200) visited a museum or art gallery
- 30% (809,600) attended a performing arts event.
Public libraries
While the attendance rates at public libraries were higher for girls (58%) than boys (53%) they were similar for the different age groups (around 55%). Attendance rates for the states and territories ranged from 60% in South Australia to 50% in Tasmania. Children in couple families had an attendance rate of 56% compared with 50% for children in one-parent families.
Museums and art galleries
There were 995,200 children who visited a museum or art gallery during the 12 month period. The rate of attendance at museums or art galleries was similar for boys and girls (38% and 36% respectively). The attendance rate was the same for 5 to 8 and 9 to 11 year olds (40%) but lower (31%) for those aged 12 to 14 years. Children born overseas in main English-speaking countries were more likely to go to a museum or art gallery (48% attending) compared with those born in Australia (38%) and in non English-speaking countries (26%). Attendance at museums and art galleries ranged from 60% for children in the Australian Capital Territory to 32% for those in New South Wales.
Performing arts events
There were 809,600 children who attended a performing arts event (453,500 girls and 356,100 boys) during the 12 month period. The attendance rate for girls (35%) was higher than that for boys (26%) and was similar for all age groups. For children born in non English-speaking countries, the rate of attendance at performing arts events (19%) was less than that for children born in Australia and other main English-speaking countries (both 31%). Attendance rates ranged from 45% in the Australian Capital Territory to 27% in both the Northern Territory and New South Wales. Children in one-parent families were less likely to attend performing arts events (27%) than those in couple families (31%).
SELECTED OTHER ACTIVITIES
Participation
Information was collected on participation in a range of mainly leisure activities outside of school hours during the previous two school weeks. During that two week period:
- 97% (2,596,000) of children had watched television, videos or DVDs
- 83% (2,209,100) had done homework or other study
- 74% (1,984,000) had read for pleasure
- 68% (1,806,200) had been bike riding
- 64% (1,695,800) had played electronic or computer games
- 49% (1,309,100) had spent time on art and craft activities
- 24% (627,800) had been skateboarding or rollerblading.
PARTICIPATION IN SELECTED OTHER ACTIVITIES, By sex
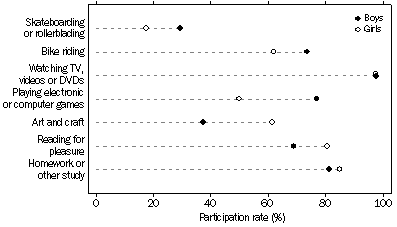
Participation rates for boys and girls were virtually the same when it came to watching television, videos or DVDs (around 97%). Participation rates were similar (between 81% and 85%) for both sexes for homework or other study. However, while 77% of boys played electronic or computer games at least once during the last two school weeks before the interview, only 50% of girls did likewise. Conversely, while 80% of girls read for pleasure during the same period, only 69% of boys did so. As with the organised activities, boys were more likely to take part in the physical activities of bike riding, skateboarding and rollerblading and less likely to take part in the cultural activity - art and craft.
Time spent
Not only was the participation rate highest for 'watching television, videos or DVDs', on average, children involved spent more time on this activity than on any of the other selected activities. Children who watched spent an average of approximately 20 hours in the two week reference period viewing television programs, videos or DVDs. By comparison, children who played spent an average of 8 hours on electronic and computer games. An average of 7 hours was spent on both reading for pleasure and homework and other study outside school hours while 6 hours was spent on each of the other selected activities.
COMPUTER ACTIVITIES
Participation
In the 12 months to April 2006 the majority (92% or 2,463,300) of children aged 5 to 14 years used a computer either during or outside school hours. Of these children, it is estimated that:
- 90%(2,229,300) used a computer at school
- 89% (2,190,600) used a computer at home
- 37% (916,300) used a computer at someone else's home
- 12% (293,600) used a computer at a public library.
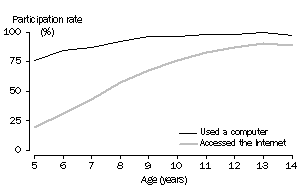
Use of a computer was similar for males and females. Computer usage varied with age, ranging from a participation rate of 76% for 5 year olds to 99% for children aged 13 years.
PARTICIPATION IN COMPUTER AND INTERNET ACTIVITIES, By age
Of the children who used a computer at home, most did so on more than one day each week (1,643,700 or 75%). An estimated 25% (557,600) used a computer every day.
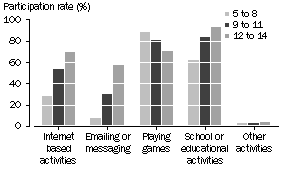
The types of activities undertaken using a home computer also varied with age. For 5 to 8 year olds, playing games was the most common activity, with 88% taking part at least once in the previous year. By comparison, 70% of children aged 12 to 14 years were reported to have taken part in this activity. Playing games was the only home computer activity which showed a decrease with age. Rates of computer use for school or educational activities, Internet based activities, and particularly emailing or messaging, were substantially higher for 12 to 14 year olds than for 5 to 8 year olds.
HOME COMPUTER USAGE, By age
Internet usage
In the 12 months to April 2006, an estimated 1,730,700 (65%) children aged 5 to 14 years accessed the Internet either during or outside of school hours. This represents 70% of the total number of children who used a computer. The proportion of children accessing the Internet was the same for both males and females (65%). Internet access varied across the age groups with 19% of children aged 5 years accessing the Internet compared with 90% of 13 year olds.
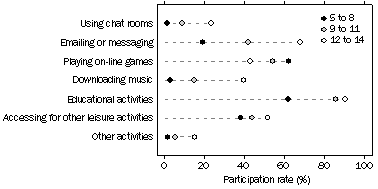
HOME INTERNET USAGE, By age
Of those children who accessed the Internet, it is estimated that:
- 85% (1,471,000) accessed the Internet at home
- 75% (1,294,400) accessed the Internet at school
- 28% (487,700) accessed the Internet at someone else's home
- 9% (147,600) accessed the Internet at a public library
- 2% (34,800) accessed the Internet at other places (e.g. Internet cafes).
The most common activities undertaken using the Internet at home were school or educational activities (82%), followed by playing on-line or Internet based games (51%). For 5 to 8 year olds, it was playing on-line or Internet based games and school or educational activities (both 62%), followed by accessing the Internet for leisure (38%).
Approximately 86% (437,600) of 9 to 11 year olds used the Internet at home for school or educational activities. Playing on-line or Internet based games (54% or 276,000), accessing the Internet for leisure (44% or 224,000) and emailing or messaging (42% or 214,600) were the next most reported activities for 9 to 11 year olds.
An estimated 90% (576,700) of 12 to 14 year olds accessed the Internet at home for school or educational activities. This was followed by emailing or messaging (68% or 434,100), accessing the Internet for leisure (52% or 330,100), playing on-line or Internet based games (43% or 275,100) and downloading music from Internet sites (40% or 253,400).
An estimated 73% (1,077,000) of children who access the Internet at home did so more than once a week and 25% (371,400) did so every day. About 39% (248,200) of 12 to 14 year olds, 18% (92,100) of 9 to 11 year olds and 10% (31,100) of 5 to 8 year olds accessed the Internet daily.
 Print Page
 Print All