NOTES
BACKGROUND
This publication presents estimates of expenditures and revenues related to environment protection and natural resource management by local government authorities of Australia. The information is collected using an adaptation of an international framework known as the European System for the Collection of Economic Information on the Environment (SERIEE), which was developed in 1994 by the European Statistical Office (Eurostat).
The collection was developed in response to requests by local governments, local government associations and others for national information on local government financial transactions related to managing the environment and natural resources. Such information is not available in a detailed form in Public Finance Statistics.
The estimates presented are useful to policy makers in state and Commonwealth governments, to local government associations, to local councils themselves as well as to any other parties interested in management of the environment by local government authorities. The estimates collected from 1997-98 until 2000-01, and in 2002-03 demonstrate that local government is a significant player in managing the nation's environment and natural resources.
This is the fifth time this survey has been conducted in Australia. The ABS welcomes feedback from readers regarding the usefulness, range and quality of the data presented and explanations provided. Please send any comments to the Director, Environment and Energy Business Statistics Centre, Australian Bureau of Statistics, GPO Box 66, Hobart, TAS 7001.
INQUIRIES
For further information about these and related statistics, contact the National Information and Referral Service on 1300 135 070 or Kevin Kingston on Hobart (03) 6222 5841.
ENVIRONMENT TRANSACTIONS
Local Government Environment Transactions - 2002-03

Environment protection
Environment protection activities are those that prevent, reduce or eliminate pressures on the environment arising from social and economic activities. They also cover activities aimed at repairing or restoring damage to the environment after it has occurred.
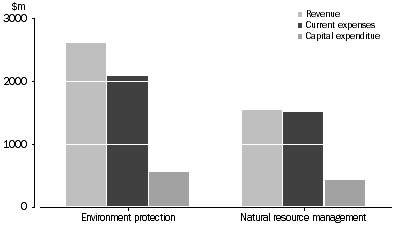
- Local government received over $2.6b in revenue for environment protection activities. This amounted to 13% of total revenue for councils in Australia and was mainly revenue from rates ($2.1b).
- Queensland received the most revenue ($1b) of all states for environment protection activities.
- Environment protection expenditure was over $2.6b, which comprised just over $2.1b in current expenditure and $558m in capital expenditure.
- There was a revenue shortfall of $28m, which was 83% less than the shortfall in 2000-01 as councils move towards balancing revenue and expenditure for environment protection.
- New South Wales had the highest level of environment protection expenditure, with current expenditure of $839m and capital expenditure of $193m.
Natural resource management
Natural resource management activities include the management, allocation and efficient use of natural resources (trees, land, water, quarrying materials). Also included are activities associated with the recreational use of the environment, such as the management of parks, beaches and reserves.
- Over $1.5b was received by councils for natural resource management activities. This amounted to 8% of councils' total revenue.
- Queensland has the highest level of natural resource management revenue ($940m) and expenditure ($542m of current expenditure and $149m of capital expenditure).
- Natural resource management current expenditure ($1.5b) and natural resource management capital expenditure ($422m) were 8% and 9% of councils' total current and capital expenditure respectively.
- The revenue shortfall for natural resource management ($396m) was significantly higher than for environment protection activities. This was a 9% decrease from the 2000-01 natural resource management revenue shortfall of $433m.
Other
- Medium sized councils (resident population of 10,000-39,999) spent more per capita on environment protection activities ($121 of current expenditure and $37 of capital expenditure) than small (population of less than 10,000) or large councils (population greater than 40,000). Small councils spent more per capita on natural resource management activities ($115 of current expenditure and $31 of capital expenditure) than medium sized or large councils.
- Small and medium sized councils had greater expenditure than revenue for both environment protection and natural resource management activities while large councils had greater expenditure than revenue for natural resource management activities.
- State governments contributed $105m to local government for environment protection activities and $46m for natural resource management activities. Commonwealth government contributed $29m to local government for environment protection activities and $11m for natural resource management activities. The bulk of government funding was for waste water management activities ($70m or 53% of government contributed environment protection funding) and water supply activities ($33m or 58% of natural resource management funding).
Time series
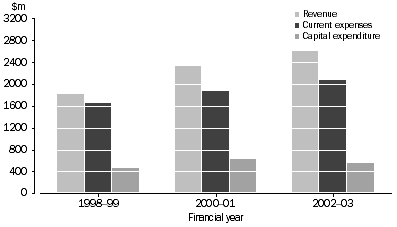
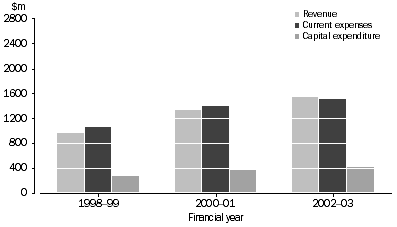
The following two graphs show the environment protection and natural resource management revenue and expenditure for the financial years, 1998-99, 2000-01 and 2002-03.
Environment Protection Transactions

The time series for environment protection demonstrates that councils are maintaining the relativity between revenue and current expenses, whereby revenue exceeds current expenditure. Revenue and current expenses increased 12% and 11% respectively between 2000-01 and 2002-03. A 16% decrease in capital expenditure for waste water, from $447m to $376m, was reflected in a 9% decrease in total capital expenditure for environment protection.
Natural Resource Management Transactions

The time series for natural resource management reflects a move towards balancing current expenditure with revenue. However, depreciation was included in the 1998-99 expenses, but excluded for the later years. Between 2000-01 and 2002-03, revenue increased by 15% (from $1.3b to $1.5b) whereas current expenditure increased by just over half that rate (from $1.4b to 1.5b). Capital expenditure increased 14%, from $370m to $422m, mainly as a result of a $25m increase in capital expenditure each for water supply and land management.
 Print Page
 Print All