 USING TABLEBUILDER
For general information relating to TableBuilder or instructions on how to use features of the TableBuilder product, please refer to the User Manual: TableBuilder, 2013 (cat. no. 1406.0.55.005).
More specific information relevant to the Crime Victimisation TableBuilder, which should enable users to understand and interpret the data, is outlined below.
COUNTING UNITS AND WEIGHTS
Weighting is the process of adjusting results from a sample survey to infer results for the total population. To do this, a 'weight' is allocated to each person. The weight is the value that indicates how many population units are represented by the sample unit.
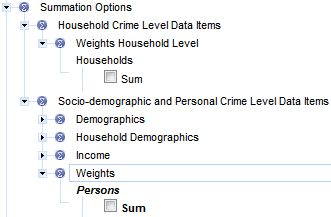
Estimates of persons and households can be obtained when using the Crime Victimisation TableBuilder. It is therefore critical that the correct weight (or 'summation option') is used when specifying tables. The following image shows the available Summation Options. Socio-demographic and Personal Crime Data Items has 3 extra options: Demographics, Household Demographics and Income. These options contain continuous data items, which are discussed below.

Generally, the 'Socio-demographic and Personal Crime Level' relates to people so a person weight is attached to this level in the 'Summation Options'; the 'Household Crime Level' relates to households so a household weight is attached to this level.
The default weight when producing any table using the Crime Victimisation TableBuilder is the person weight (in bold in the image above). This weight is automatically applied to any table being generated. If a weight is in bold, such as in the image above, this means that this weight is currently being used in the table. Placing a tick in a 'Sum' tick box and then adding it to a row or column in the table will select a different weight.
While the default is person weight, it is also possible to specifically select person weight through 'Summation Options'. To estimate the number of persons with certain characteristics (e.g. 'Number of assaults experienced by a person in the last 12 months') the weight listed under the category heading 'Socio-demographic and Personal Crime Level' must be used. To specifically select a person weight through Summation Options:
1. Click on the blue triangle 'twistie' ( ) next to the 'Summation Options' line
2. Ensure all 'Sum' tick boxes are blank
3. Click on the 'Socio-demographic and Personal Crime Level' 'twistie'
4. Click on the 'Person Weight' 'twistie'
5. Click on the 'Sum' tick box
6. Add the person weights to your table by clicking on 'add to row' or 'add to column'
To estimate the number of households with certain characteristics (e.g. 'Number of break-ins experienced by households in the last 12 months') the weight listed under the category heading 'Household Crime Level' must be used. The same process as above can be followed, ticking the 'Sum' tick box under the Household Crime Level 'twistie' instead.
The following table summarises the weights recommended for use with each of the levels:
| Level | Summation option weights | Unit of measure |
| Socio-demographic and Personal Crime Level | Number of Socio-demographic and Personal crime data items | Person |
| Household Crime Level | Household Crime Level Data Items | Household |
| Household Crime Level x Socio-demographic and Personal Crime Level (except Demographics, Education, Labour Force, Personal Income) | Household Crime Level Data Items | Household |
CONTINUOUS DATA ITEMS
Some continuous data items are allocated special codes for certain responses (e.g. 9999 = 'Not applicable'). When creating ranges for such continuous items for use in the TableBuilder, these special codes will NOT be included in these ranges. Therefore the total shown only represents 'valid responses' of that continuous data item rather than all responses (including special codes).
For example:
The following table shows the responses for 'Weekly personal income from all sources' by 'Sex of person'. The continuous values of the data item are contained in the 'A valid response was recorded' row. If the actual continuous values are to be displayed then it is necessary to create a range for them.

Here is the same table with a range applied for the continuous values of 'Weekly personal income from all sources' (IncExample). Note that the numbers of respondents for the other responses 'Not stated' and 'Refusal' no longer contribute to the table.

Any special codes for continuous data items are listed in the Data Item List.
SELECTING DATA ITEMS FOR CROSS-TABULATION
Apart from the Field Exclusion Rules that are applied in TableBuilder, there are minimal restrictions on the items that can be selected to appear in a table. That is, generally, users are able to cross-tabulate any variable with any other variable on the file. However, often the resulting table is not logical. For example, 'Whether household experienced a break-in in the last 12 months' by 'Whether weapon used in most recent incident of physical assault'
cross-tabulates two different types of crimes which have no meaningful connection.
The following table summarises when variables should and should not be cross-tabulated.
 | Socio-demographic and Personal Crime
Data Items | Household Crime Level Data Items |
| Socio-demographic and Personal Crime Data Items |  |  |
|
| √ | √ |
|
| √ | X |
Exception: Index of relative socio-economic index disadvantage - Deciles
| √ | √ |
|
| √ | √ |
|
| √ | X |
|
| √ | X |
|
|  |  |
|
| √ | √ |
|
| √ | X |
|
| √ | X |
Perceptions of the Justice System
| √ | X |
| Household Crime Level Data Items | See column 3 | √ |
FIELD EXCLUSION RULES
To ensure confidentiality, TableBuilder prevents the cross-tabulation of certain variables which could result in respondents being identified. These are know as field exclusion rules. If field exclusion rules exist for certain variables, users will see the following message:
“Maximum number of fields in exclusion group exceeded.”
ADJUSTMENT OF CELL VALUES
The TableBuilder dataset has random adjustment of cell values applied to avoid the release of identifiable data. All cells in a table are adjusted to prevent any identifiable data being exposed. For this dataset 'additivity' has not been applied, that is, when the interior cells are randomly adjusted they have
not been set to add up to the totals. As a result, randomly adjusted individual cells will be consistent across tables, but the totals in any table will not be the sum of the individual cell values.
INTERPRETATION OF RESULTS
Crime victim surveys are best suited to measuring crimes against individuals or households with specific victims. Victims need to be aware of and recall what happened to them and how it happened, as well as be willing to relate what they know to interviewers.
Not all types of crime are suitable for measurement by household surveys. No reliable information can be obtained about crimes without specific victims, such as trafficking in narcotics. Crimes of which the victim may not be aware cannot be measured effectively - some crimes involving deception and attempted crimes of many types may fall into this category. It may also be difficult to obtain information about some crimes such as sexual offences and assault committed by other household members due to the sensitivity of the crime and an increased reluctance to disclose. Some of these crimes may not be fully reflected in the data collected. Household survey data excludes crimes against commercial establishments or government agencies.
This survey covered only selected types of personal and household crimes. Personal crimes covered in the survey were physical assault, threatened assault, robbery and sexual assault. Household crimes covered were break-in, attempted break-in, motor vehicle theft, theft from a motor vehicle, malicious property damage and other theft. The survey also covered people's perceptions about the justice system in Australia, including perceptions of the police, criminal courts and prisons.
For this survey the definition of total victims is restricted to those crimes included in the survey and does not represent all crime in Australia. Information collected in this survey is essentially 'as reported' by respondents and hence may differ from that which might be obtained from other sources or via other methodologies. This factor should be considered when interpreting the estimates and when making comparisons with other data sources.
ZERO VALUE CELLS
Tables generated from sample surveys will sometimes contain cells with zero values because no respondents that satisfy the parameters of the cell were in the survey. This is despite there being people in the population with those characteristics. That is, the cell may have had a value above zero if all persons in scope of the survey had been enumerated. This is an example of sampling variability which occurs with all sample surveys. Relative Standard Errors cannot be generated for zero cells. Whilst the tables may include cells with zero values, the ABS does not publish such zero estimates in Crime Victimisation, Australia, 2011-12 (cat no. 4530.0) and recommends that TableBuilder clients do not use these data either.
DATA COLLECTION INSTRUMENT
Data was collected using Computer Assisted Interviewing (CAI), whereby responses were recorded directly onto an electronic questionnaire in a notebook computer, usually during a telephone interview. A copy of the household survey questions used to collect the Crime Victimisation data will be sent to TableBuilder users when access to the STB file is given. Response categories in the data collection instrument represent input categories and are not always available as separate output categories on the TableBuilder file as categories are collapsed for output to improve data quality and maintain confidentiality. However it is important that users consider precise question wording, question order and sequencing and the range of input categories to assist them to interpret the data.
MULTI–RESPONSE DATA ITEMS
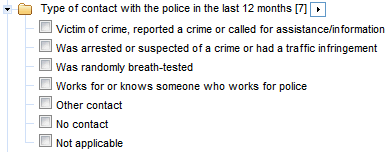
A number of the survey's data items allow respondents to provide more than one response. These are referred to as 'multi–response data items'. An example of such a data item is shown below. For this data item, respondents can report all types of contact which they have had with the police in the last 12 months.

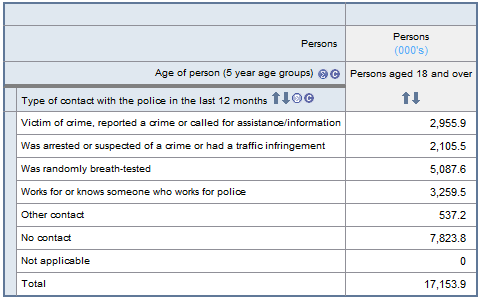
When a multiple response data item is tabulated, a person is counted against each response they have provided (e.g. a person who was randomly breath-tested and also had "other contact" with the police will be counted one time in each of these two categories).
As a result, each person in the appropriate population is counted at least once, and some persons are counted multiple times. Therefore, the total for a multiple response data item will be less than or equal to the sum of its components. Multi–response data items can be identified by the initials 'MR' in the data item list, which can be accessed from the Downloads page. In the example below, the sum of the components is 21,769,500 whereas the total population is 17,153,900.

NOT APPLICABLE CATEGORIES
Most data items include a 'not applicable' category. The 'not applicable' category comprises those respondents who were not asked a particular question(s) and hence are not applicable to the population to which the data item refers. The classification value of the 'not applicable' category, where relevant, is shown in the data item list (see the Data Item List in the Downloads tab).
 Print Page
 Print All
 Quality Declaration