Notes
About this publication
This publication presents national statistics on prisoners who were in custody on 30 June 2004. These statistics describe the characteristics of prisoners, sentencing lengths, and offences for which offenders are imprisoned, and provide a basis for measuring change over time.
Changes in this issue
Historical rates for total prisoners, and Indigenous prisoners presented in table 17, have been revised using population estimates benchmarked on the 2001 Census of Population and Housing and back cast for the period 1994 to 2003.
Rates for the Indigenous adult population in this publication are based on the 'low series' projections for 30 June 2004 (Experimental Estimates and Projections, Aboriginal and Torres Strait Islander Australians, 30 June 1991 to 30 June 2009 (cat. no. 3238.0)). These projections are based on the 2001 Census of Population and Housing. Previous issues of this publication presented rates based on projections using the 1996 Census of Population and Housing.
Indigenous and non-Indigenous imprisonment rates included in table 3 are presented as both crude and age standardised rates. Ratios of Indigenous to non-Indigenous imprisonment rates are also included.
Further information about the age standardisation of rates and Indigenous adult population estimates are provided in Appendix 2 - Indigenous imprisonment rates.
Adult population figures used in the calculation of rates are for persons aged 18 years and over for all states and territories except for Victoria and Queensland, where the adult population used is that of persons aged 17 years and over (see paragraph 11 of the Explanatory Notes). In previous issues, rates were calculated using adult population figures for persons aged 17 years and over. Historical rates for total and Indigenous prisoners, presented in table 16, have been revised for 1994 to 2003 to reflect changes in the methodology used to create the adult population.
The rules for determining the most serious offence for prisoners returning to prison with a breach of parole have been modified. Further information is available in paragraph 65 of the Explanatory Notes.
Further Information
More information about ABS activities in the field of crime and justice statistics is available from the Crime and Justice theme page on the ABS website. Details of other ABS publications relating to Crime and Justice statistics can be found in paragraphs 74-75 of the Explanatory Notes.
Acknowledgements
The ABS acknowledges the valuable contribution of the Board of Management and Advisory Group of the National Corrective Services Statistics Unit and the staff of the various agencies that provide the statistics that are presented in this publication.
Inquiries
For further information about these and related statistics, contact the National Information and Referral Service on 1300 135 070 or Nick Skondreas on Melbourne (03) 9615 7381.
Summary of Findings
INTRODUCTION
This publication presents information from the National Prisoner Census about persons held in Australian prisons on the night of 30 June 2004. The National Prisoner Census covers all prisoners in the legal custody of adult corrective services, including periodic detainees in New South Wales and the Australian Capital Territory, but excluding persons held in juvenile institutions, psychiatric custody and police custody. It is based on data extracted from administrative records held by the corrective services agencies in each Australian state and territory. These statistics provide a profile of the demographic characteristics, legal status and sentence details of Australian prisoners.
Users of this publication should note that it provides a picture of the persons in prison at a point in time, and does not describe the flow of prisoners during the year. The majority of prisoners in the annual Prisoner Census are serving long-term sentences for serious offences, whereas the flow of offenders in and out of prisons consists primarily of persons serving short sentences for lesser offences. The information in this publication is supplemented with monthly statistics about Australian prisoners in the Australian Bureau of Statistics (ABS) quarterly publication Corrective Services, Australia (cat. no. 4512.0).
The Explanatory Notes provide detailed information on the data sources, definitions, counting rules and other technical matters associated with this publication.
PRISONERS
There were 24,171 prisoners in Australia on 30 June 2004, an increase of 3% on the 23,555 prisoners at 30 June 2003. The imprisonment rate of 157 prisoners per 100,000 adult population represents a 1% increase on the rate of 155 prisoners per 100,000 adult population in 2003.
The prisoner population has increased by 43% since 1994. This increase has exceeded the 15% growth in the Australian adult population, resulting in the adult imprisonment rate increasing from 127 to 157 prisoners per 100,000 adult population between 1994 and 2004.
IMPRISONMENT RATES(a)
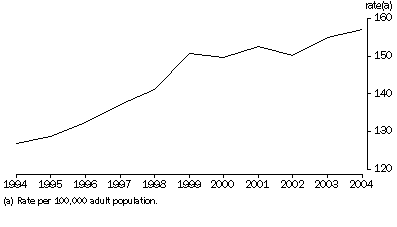
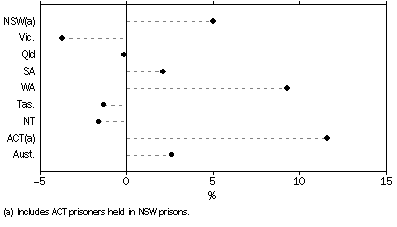
Three quarters of all prisoners are held in New South Wales (9,329 prisoners), Queensland (5,240) and Victoria (3,624). Between 2003 and 2004, the prison population increased in the Australian Capital Territory (12%), Western Australia (9%), New South Wales (5%) and South Australia (2%), while decreases occurred in Victoria, the Northern Territory, Tasmania and Queensland (a decrease of 4%, 2%, 1% and less than 1% respectively).
CHANGE IN PRISONER NUMBERS BETWEEN 30 JUNE 2003 AND 30 JUNE 2004
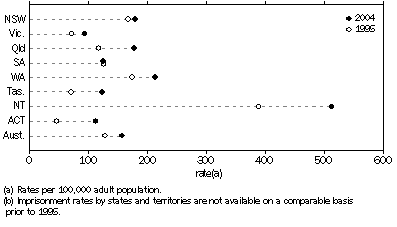
The Northern Territory recorded the highest imprisonment rate of 513 prisoners per 100,000 adult population. While this is three times the national rate, the imprisonment rate for the Northern Territory decreased by 2% since 2003. Victoria recorded the lowest imprisonment rate of 94 prisoners per 100,000 adult population, followed by the Australian Capital Territory (113 prisoners per 100,000 adult population). The highest imprisonment rate increases between 2003 and 2004 were in the Australian Capital Territory (11%) and Western Australia (8%). The highest imprisonment rate decreases between 2003 and 2004 were in Tasmania and Victoria (a decrease of 3% and 2% respectively). Between 1995 and 2004, all states and territories (with the exception of South Australia) recorded an increase in imprisonment rates.
IMPRISONMENT RATES(a)(b) — 1995 and 2004
Indigenous prisoners
There were 5,048 Indigenous prisoners in Australia (21% of the prisoner population) at 30 June 2004.
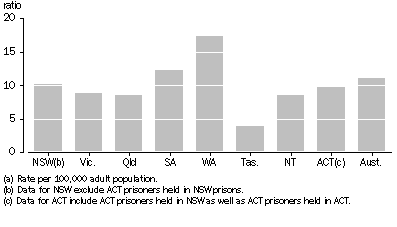
The crude imprisonment rate for the Indigenous population was 1,852 prisoners per 100,000 population. After adjusting for age differences between the Indigenous and non-Indigenous populations, Indigenous people were 11 times more likely than non-Indigenous people to be imprisoned (age-standardised imprisonment ratio).
Western Australia recorded the highest age standardised ratio of Indigenous to non-Indigenous rates of imprisonment with Indigenous persons 17 times more likely than non-Indigenous persons to be in prison. Tasmania had the lowest age standardised ratio of Indigenous to non-Indigenous rates of imprisonment, with Indigenous persons four times more likely than non-Indigenous persons to be in prison.
RATIO OF INDIGENOUS TO NON-INDIGENOUS AGE STANDARDISED RATES OF IMPRISONMENT(a)
AGE AND SEX
There were 22,499 male prisoners at 30 June 2004 (93% of the prisoner population) and 1,672 female prisoners (7% of the prisoner population). The proportion of prisoners who were female ranged from 2% in Northern Territory to 8% in Western Australia. The imprisonment rate for males was 297 per 100,000 adult male population and for females it was 21 per 100,000 adult female population. While males were 14 times more likely than females to be in prison, over the past 10 years the female prisoner population has increased at a faster rate than the male prisoner population. Between 1994 and 2004, the female prisoner population has increased by 101%, in comparison to a 40% increase in the male prisoner population.
CHANGE IN PRISONER NUMBERS BETWEEN 30 JUNE 1994 AND 30 JUNE 2004
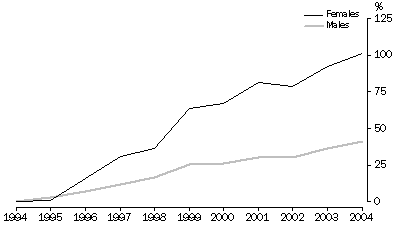
Just over half of all prisoners were males aged between 20 and 34 years. The 25-29 year age group had the highest imprisonment rates for both males and females, with 641 male prisoners per 100,000 adult males aged 25-29, and 49 female prisoners per 100,000 adult females aged 25-29.
Indigenous prisoners
The age profile for Indigenous prisoners is younger than that for the overall prisoner population, with the median age for Indigenous prisoners of 29.8 years being 2.4 years less than the 32.2 years for all prisoners. Over one in twenty (6%) of all Indigenous males aged 25-29 years were in prison at 30 June 2004 (compared with 0.6% of all males aged 25-29 years).
BIRTHPLACE
Approximately three-quarters of prisoners were born in Australia (74%). Prisoners born in Viet Nam were the next largest birthplace grouping (2.8%), followed by those born in the country category of United Kingdom and Ireland (2.6%) and New Zealand (2.5%).
PREVIOUS IMPRISONMENT
The proportion of all prisoners with known prior imprisonment was 58% at 30 June 2004. The proportion of Indigenous prisoners with prior imprisonment was 77%.
MOST SERIOUS OFFENCE/CHARGE
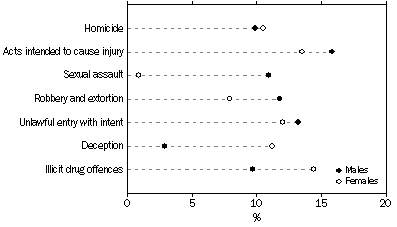
A most serious offence/charge is determined for each prisoner (see paragraphs 64-66 of the Explanatory Notes). The largest proportions of most serious offences/charges for which prisoners were either sentenced or being held on remand at 30 June 2004 were: acts intended to cause injury (16% of prisoners); unlawful entry with intent (13% of prisoners); and robbery/extortion (12% of prisoners). Prisoners within these offence categories also had a higher level of prior imprisonment than the overall prisoner population (63%, 74% and 62% of prisoners respectively).
There were proportionally more males in prison for sexual assault and related offences (11% of males, 1% of females), while deception and related offences was the most serious offence category for 11% of females and 3% of males. A higher proportion of females were also in prison for illicit drug offences (14% of females, 10% of males) and theft and related offences (12% of females and 6% of males).
PRISONERS, by selected most serious offence/charge
LEGAL STATUS
The prisoner population comprises persons who are either unsentenced or sentenced. The proportion of prisoners who were unsentenced decreased slightly between 2003 and 2004 from 21% to 20%. This proportion, however, varied across states and territories ranging from 15% in Tasmania to 35% in South Australia.
SENTENCED PRISONERS
Of those prisoners who were sentenced, the majority (56%) were serving a maximum-minimum sentence. This type of sentence relates to prisoners who may be eligible for release on parole after serving a minimum term in custody, and who must be released once the maximum term has been served. A further 34% of sentenced prisoners were serving a fixed term, while 5% were serving an indeterminate sentence (including life imprisonment).
Most prisoners were sentenced in either the District/County Court (49%) or the Magistrates' Court (27%), with 20% sentenced in the Supreme Court.
Most serious offence
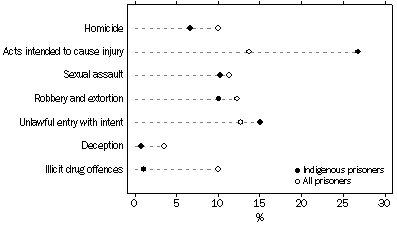
Of the 19,236 sentenced prisoners, nearly one in two prisoners (47%) had a most serious offence involving violence or the threat of violence, including offences such as acts intended to cause injury (14%), robbery/extortion (12%), sexual assault and related offences (11%) and homicide and related offences (10%). Thirteen per cent of sentenced prisoners were convicted of unlawful entry with intent as their most serious offence and 10% of sentenced prisoners were convicted of illicit drug offences as their most serious offence.
Between 1994 and 2004 there have been increases in the proportions of the sentenced prisoner population who had a most serious offence of acts intended to cause injury (increasing from 11% to 14%) and homicide and related offences (from 9% to 10%). During the same period, small decreases were recorded for unlawful entry with intent (decreasing from 14% to 13%), illicit drug offences (from 11% to 10%) and theft and related offences (from 7% to 6%).
Most serious offence - Indigenous prisoners
Of the 4,025 Indigenous sentenced prisoners, 27% had a most serious offence of acts intended to cause injury, almost twice the proportion for the overall sentenced prisoner population (14%). In contrast, 1% of the Indigenous prisoner population had a most serious offence relating to illicit drug offences, compared with 10% for the overall prisoner population.
SENTENCED PRISONERS, by selected most serious offence
Sentence length
The median aggregate sentence length for all sentenced prisoners at the 30 June 2004 was 38 months or 3.2 years. (See paragraphs 60-63 of the Explanatory Notes for information about interpreting mean and median sentence lengths based on a census 'snapshot'). Prisoners who had received a 'Life' sentence comprised 4% of all sentenced prisoners while prisoners serving an aggregate sentence of less than one year comprised 17%. Nearly half (45%) of sentenced prisoners had an aggregate sentence of 2-10 years.
The proportion of sentenced prisoners serving an aggregate sentence length of 10 years and over has increased over the past 10 years; 10% of sentenced prisoners in 1994 had an aggregate sentence length of 10 years and over, compared with 13% in 2004.
Sentence length - Most serious offence
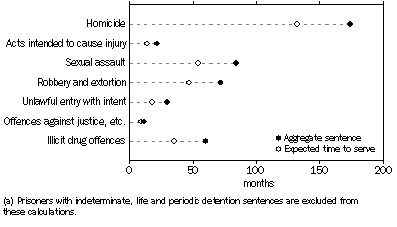
The highest median aggregate sentence length was for prisoners with a most serious offence of homicide (174 months or 14.5 years), followed by sexual assault and related offences (84 months or 7 years). In contrast, the median aggregate sentence length for prisoners with road traffic and motor vehicle regulatory offences, was 9 months.
Sentence length - Expected time to serve
Taking into account the earliest dates for release of sentenced prisoners, the median expected time to serve at 30 June 2004 was 24 months (2 years), up slightly from the 21 months (1.8 years) recorded at 30 June 2003. The proportion of prisoners with an expected time to serve of less than one year at 30 June has decreased from 31% in 2003 to 28% in 2004.
SENTENCED PRISONERS, by median sentence length(a)
Sentence length - Indigenous prisoners
Differences in offence types and severity between Indigenous and non-Indigenous prisoners are reflected in differences in sentence lengths. A larger proportion of Indigenous prisoners were serving shorter sentences than the overall prison population at 30 June 2004, with 39% of Indigenous prisoners expected to serve less than 12 months, compared with 28% of all prisoners.
SENTENCED PRISONERS, by expected time to serve
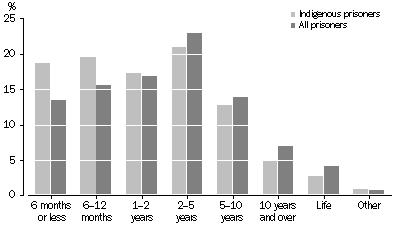
The median aggregate sentence length for Indigenous prisoners was 24 months (2 years), while the median expected time to serve was 15 months (1.3 years).
PERIODIC DETAINEES
The sentencing option of periodic detainment, where detainees are in custody for two consecutive days in a week and remain at liberty for the rest of the week, applies only in New South Wales and the Australian Capital Territory. There were 830 periodic detainees as at 30 June 2004, a decrease of 4% since 2003.
UNSENTENCED PRISONERS
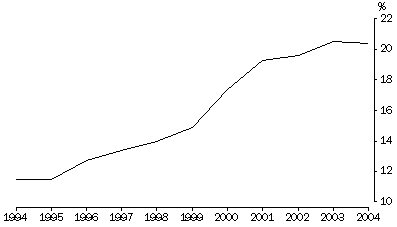
Unsentenced (remand) prisoners include unconvicted prisoners awaiting a court hearing or trial, convicted prisoners awaiting sentencing and persons awaiting deportation. The proportion of unsentenced prisoners remained unchanged since 2003 with 20% (4,935) of the total prisoner population in this category at 30 June 2004. Over the past 10 years, unsentenced prisoners have accounted for an increasing number and proportion of the total prisoner population. The proportion of prisoners on remand has increased from 12% in 1994 to 20% in 2004.
UNSENTENCED PRISONERS
Most serious charge
Of the unsentenced prisoner population, 23% were awaiting trial or sentence for a most serious charge related to acts intended to cause injury (24% in 2003), 15% for unlawful entry with intent (16% in 2003) and 9% for robbery/extortion (11% in 2003).
Remand length
The median time spent on remand up to 30 June 2004 was 2.8 months. One in ten prisoners held on remand at 30 June had spent more than 12.5 months in custody (a 10% decrease on the previous year).
 Print Page
 Print All