|
|
PRISONERS
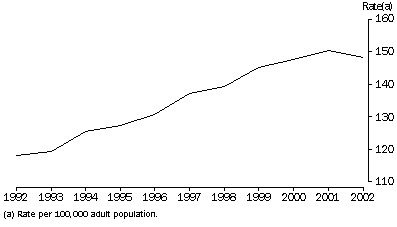
There were 22,492 prisoners in Australia on 30 June 2002, an increase of less than 1% on the 22,458 prisoners at 30 June 2001. The imprisonment rate of 148 prisoners per 100,000 adult population represents a 1% decrease on the rate of 151 prisoners per 100,000 adult population at 30 June 2001. This is the first decrease in the national imprisonment rate in the period 1992–2002. New South Wales had the largest prisoner population of 8,759 with Queensland (4,721) having the next largest number of prisoners. The highest imprisonment rate of 466 prisoners per 100,000 adult population was recorded in the Northern Territory. While this is three times the national rate, it is 9% below the 2001 rate for the Northern Territory of 511 prisoners per 100,000 adult population.
IMPRISONMENT RATES(a)

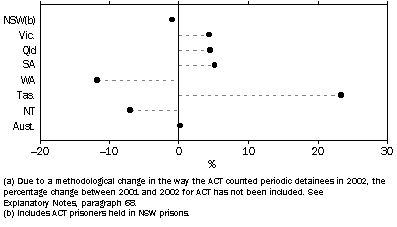
Between 2001 and 2002 Tasmania recorded a 23% increase in the number of prisoners, the largest for any state or territory. A policy of more active opposition by police to bail contributed to an increase in remandees, while for sentenced prisoners, the number expected to serve short sentences (less than 6 months) increased by over 40% and the number expected to serve 1–2 years nearly doubled. In contrast, Western Australia recorded a 12% decrease in the number of prisoners as a result of an increase in the acquittal and dismissal rates in courts, greater use by the courts of suspended imprisonment and community orders as penalties, and a decrease in the breach rate for early release orders. The 1% decrease in total prisoner numbers in New South Wales resulted from the 15% decrease in the number of periodic detainees.
CHANGE IN PRISONER NUMBERS BETWEEN 30 JUNE 2001 AND 2002(a)

Indigenous prisoners
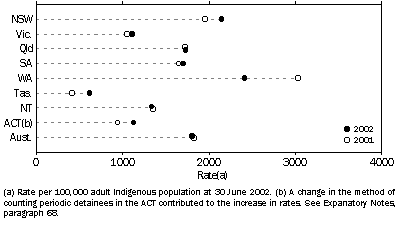
There were 4,494 Indigenous prisoners in Australia (20% of the prisoner population) at 30 June 2002. With an imprisonment rate of 1,806 prisoners per 100,000 adult Indigenous population, Indigenous persons were 15 times more likely than non-Indigenous persons to be in prison. While the highest Indigenous imprisonment rate of 2,414 prisoners per 100,000 adult Indigenous population was recorded in Western Australia, this is well below the 3,036 prisoners per 100,000 adult Indigenous population recorded a year earlier. The impact of the factors outlined in the previous paragraph on Western Australia's imprisonment rates between 2001 and 2002 has been greater for Indigenous prisoners (20% decrease) than non-Indigenous prisoners (9% decrease). The 20% decrease in Western Australia, along with a 1% decrease in the Northern Territory, offset the increases in all other states and the Australian Capital Territory, resulting in a 1% decrease in the national Indigenous imprisonment rate.
INDIGENOUS IMPRISONMENT RATES(a)

AGE AND SEX
Approximately 40% of prisoners were males aged between 20 and 29 years. The 25–29 year age group had the highest imprisonment rates for both males and females, with 639 male prisoners per 100,000 adult males (4% increase on the 2001 rate), and 51 female prisoners per 100,000 adult females (10% increase).
10 YEAR COMPARISON
Some notable changes that have occurred between the 1992 and 2002 prisoner censuses are listed below:
- The prisoner population increased from 15,559 at 30 June 1992 to 22,492 at 30 June 2002. The 45% increase in the number of prisoners during this period exceeded the 15% growth in the Australian adult population, resulting in the adult imprisonment rate increasing from 118 to 148 prisoners per 100,000 adult population.
- While males continue to be the majority of the prisoner population, the proportion of prisoners who were female increased from 5% in 1992 to 7% in 2002.
- The proportion of prisoners who were Indigenous rose from 14% in 1992 to 20% in 2002.
- The proportion of prisoners on remand has increased from 12% in 1992 to 20% in 2002.
TABLE 1. PRISONERS, By States And Territories
 | NSW(a) | Vic. | Qld | SA | WA | Tas. | NT | ACT in ACT | ACT in NSW(a) | ACT Total | Aust.(b) |
NUMBER
|
| Males | 8,154 | 3,286 | 4,433 | 1,377 | 2,606 | 397 | 646 | 109 | 116 | 225 | 21,008 |
| Females | 605 | 254 | 288 | 84 | 194 | 30 | 21 | 8 | 7 | 15 | 1,484 |
 |  |  |  |  |  |  |  |  |  |  |  |
| Indigenous | 1,503 | 160 | 1,183 | 243 | 872 | 61 | 459 | 13 | 12 | 25 | 4,494 |
| Non-Indigenous | 7,167 | 3,345 | 3,538 | 1,050 | 1,928 | 366 | 208 | 104 | 109 | 213 | 17,706 |
| Unknown | 89 | 35 | - | 168 | - | - | - | - | 2 | 2 | 292 |
 |  |  |  |  |  |  |  |  |  |  |  |
| Sentenced | 7,117 | 2,961 | 3,755 | 971 | 2,302 | 338 | 565 | 69 | 123 | 192 | 18,078 |
| Unsentenced | 1,642 | 579 | 966 | 490 | 498 | 89 | 102 | 48 | - | 48 | 4,414 |
 |  |  |  |  |  |  |  |  |  |  |  |
| All prisoners | 8,759 | 3,540 | 4,721 | 1,461 | 2,800 | 427 | 667 | 117 | 123 | 240 | 22,492 |
 |  |  |  |  |  |  |  |  |  |  |  |
PROPORTION(%)
|
| Males | 93.1 | 92.8 | 93.9 | 94.3 | 93.1 | 93.0 | 96.9 | 93.2 | 94.3 | 93.8 | 93.4 |
| Females | 6.9 | 7.2 | 6.1 | 5.7 | 6.9 | 7.0 | 3.1 | 6.8 | 5.7 | 6.3 | 6.6 |
 |  |  |  |  |  |  |  |  |  |  |  |
| Indigenous | 17.2 | 4.5 | 25.1 | 16.6 | 31.1 | 14.3 | 68.8 | 11.1 | 9.8 | 10.4 | 20.0 |
| Non-Indigenous | 81.8 | 94.5 | 74.9 | 71.9 | 68.9 | 85.7 | 31.2 | 88.9 | 88.6 | 88.9 | 78.7 |
| Unknown | 1.0 | 1.0 | - | 11.5 | - | - | - | - | 1.6 | 0.8 | 1.3 |
 |  |  |  |  |  |  |  |  |  |  |  |
| Sentenced | 81.3 | 83.6 | 79.5 | 66.5 | 82.2 | 79.2 | 84.7 | 59.0 | 100.0 | 80.0 | 80.4 |
| Unsentenced | 18.7 | 16.4 | 20.5 | 33.5 | 17.8 | 20.8 | 15.3 | 41.0 | - | 20.0 | 19.6 |
 |  |  |  |  |  |  |  |  |  |  |  |
| All prisoners | 100.0 | 100.0 | 100.0 | 100.0 | 100.0 | 100.0 | 100.0 | 100.0 | 100.0 | 100.0 | 100.0 |
|
- nil or rounded to zero (including null cells)
(a) The majority of full-time prisoners sentenced in the ACT are held in NSW prisons. See Explanatory Notes, paragraphs 10–11. |
| (b) The ACT in NSW figures are a subset of the NSW figures and are not separately counted in the Australian totals. See Explanatory Notes, paragraph 11. |
|
TABLE 2. IMPRISONMENT RATES(a), By States And Territories
 | NSW(b) | Vic. | Qld | SA | WA | Tas. | NT | ACT(c) | Aust. |
|
| Males | 318.4 | 178.4 | 319.7 | 236.2 | 356.6 | 225.7 | 862.4 | 185.1 | 282.4 |
| Females | 22.9 | 13.0 | 20.1 | 13.8 | 26.2 | 16.1 | 30.8 | 11.8 | 19.2 |
 |  |  |  |  |  |  |  |  |  |
| Indigenous | 2,146.2 | 1,109.6 | 1,733.5 | 1,703.1 | 2,413.9 | 621.6 | 1,340.0 | 1,133.8 | 1,806.3 |
| Non-Indigenous | 139.1 | 88.6 | 128.5 | 89.2 | 134.3 | 104.0 | 191.1 | 86.2 | 118.7 |
 |  |  |  |  |  |  |  |  |  |
| All prisoners | 168.0 | 93.4 | 167.3 | 122.7 | 190.2 | 118.1 | 466.2 | 96.3 | 148.3 |
|
| (a) Rate per 100,000 adult population. See Explanatory Notes, paragraphs 17–26. |  |
| (b) Data for NSW excludes ACT prisoners held in NSW prisons. |  |
| (c) Data for ACT includes ACT prisoners held in ACT as well as ACT prisoners held in NSW. |  |
TABLE 3. PRISONER CHARACTERISTICS, 1992-2002
 | All prisoners(a) | Mean age | Females | Indigenous | Known prior adult imprisonment | Remandees |
| 30 June | no. | years | % | % | % | % |
|
| 1992 | 15,559 | 30.6 | 4.9 | 14.3 | 58.2 | 12.0 |
| 1993 | 15,866 | 31.1 | 4.8 | 15.2 | 56.5 | 12.0 |
| 1994 | 16,944 | 31.4 | 4.9 | 16.5 | 60.5 | 11.5 |
| 1995 | 17,428 | 31.7 | 4.8 | 17.1 | 56.3 | 11.5 |
| 1996 | 18,193 | 31.8 | 5.3 | 18.0 | 57.4 | 12.7 |
| 1997 | 19,128 | 31.9 | 5.7 | 18.7 | 57.9 | 13.4 |
| 1998 | 19,906 | 32.5 | 5.7 | 18.8 | 62.1 | 14.0 |
| 1999 | 21,538 | 32.7 | 6.3 | 20.0 | 57.9 | 14.9 |
| 2000 | 21,714 | 32.9 | 6.4 | 18.9 | 56.4 | 17.4 |
| 2001 | 22,458 | 33.0 | 6.7 | 19.8 | 58.4 | 19.3 |
| 2002 | 22,492 | 33.4 | 6.6 | 20.0 | 58.3 | 19.6 |
|
| (a) Prior to 1997, ACT periodic detainees were not included. |
| Source: 1992–93: Australian Institute of Criminology, Australian Prisoners; 1994–2002: Australian Bureau of Statistics, Prisoners in Australia. |
National Crime and Justice Statistics Newsletter
|
 Print Page
 Print All