NOTES
ABOUT THIS PUBLICATION
This publication presents details from the 2002-03 national census of private hospitals. Three categories of hospitals are identified: acute hospitals, psychiatric hospitals and free-standing day hospital facilities.
There are relatively few psychiatric hospitals and some of these are owned by the same parent company. To maintain the confidentiality of their data, psychiatric hospitals are combined with acute hospitals in most tables in this publication. In addition, to maintain the confidentiality of respondent's data in this collection, Tasmania, Northern Territory and Australian Capital Territory hospitals have been aggregated
Any differences between the data given in this publication and the data shown in other reports on hospital activity are due to differences in scope and coverage, relative completeness of the data sources and differing error resolution procedures.
INQUIRIES
For further information about these and related statistics, contact the National Information and Referral Service on 1300 135 070 or Andrew Cumpsty on Brisbane 07 3222 6374.
SUMMARY OF FINDINGS
INTRODUCTION
This publication presents data for the private hospital sector in 2002-03. Comparable data for public hospitals is available in Australian Hospitals 2002-03, produced by Australian Institute of Health and Welfare (AIHW). According to data in that publication, during 2002-03 nearly four out of every ten hospital patients in Australia were admitted to private hospitals, representing nearly one-third of all days of hospitalisation.
There were 536 private hospitals in operation during 2002-03. These comprised 271 acute hospitals, 25 psychiatric hospitals and 240 free-standing day hospital facilities (tables 2 and 3).
During 2002-03, private hospitals in Australia:
- treated 2.6 million admitted patients (patient separations)
- provided 7.2 million days of hospitalisation to these patients (patient days)
- employed 47,500 staff (full-time equivalent)
- earned $5,758m in income (revenue)
- spent $5,401m for recurrent purposes (recurrent expenditure)
- invested $314m in buildings and other capital assets (capital expenditure).
HOSPITALS
The number of private acute and psychiatric hospitals decreased by 5 during 2002-03 to 296, continuing the downward trend of the past decade (table 1).
The growth in the number of private free-standing day hospital facilities, which has been evident for several years, continued during 2002-03, with an increase of 4 facilities to 240. The number of extra beds provided in these facilities, 146, was an 8% increase on the previous year.
BEDS
The average number of beds available in acute and psychiatric hospitals during 2002-03 was 24,454, a decrease of 1% from the previous year. The average number of beds available per hospital rose from 82 in 2001-02 to 83 in 2002-03.
Almost 74% of available beds in private acute and psychiatric hospitals during 2002-03 were in hospitals within the Capital City Statistical Divisions, where 64% of Australia's population lived. (See Explanatory Notes, paragraph 19, concerning population estimates.)
In 2002-03, private acute and psychiatric hospitals had an occupancy rate of 75.6%, a marginal increase over the previous year (75.2%) (table 1). The highest bed occupancy rate was in Victoria with 77.4% and the lowest was 72.2% for Tasmania, Northern Territory and Australian Capital Territory combined. The occupancy rate was higher in hospitals located in the Capital City Statistical Divisions (77.3%), compared with 70.9% in the Rest of State and Territory (table 5).
Private acute and psychiatric hospitals operated by religious or charitable institutions provided 37% of the available beds during 2002-03 and had the highest occupancy rate at 77.5% (table 6). The majority of these types of hospitals are large with 50 (68%) having an average of more than 50 beds available (table 4).
PATIENT SEPARATIONS
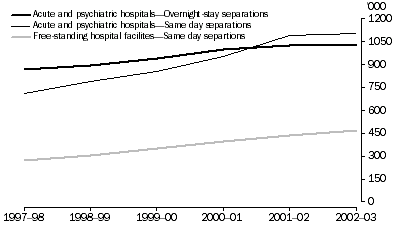
In 2002-03, there were 2.1 million patient separations from private acute and psychiatric hospitals. Total patient separations in these hospitals for 2002-03 increased only marginally (1%) when compared with increases over the two previous years which were 7% and 9%, respectively. The average annual growth rate for the last five years has been 6%.
Same day separations from private acute and psychiatric hospitals (1.1m) in 2002-03 were higher, for the second consecutive year, than overnight-stay separations (1.0m).
Patient separations from free-standing day hospital facilities during 2002-03 numbered 471,700, representing a 9% increase over the previous year. The average annual growth rate for the five years ending 2002-03 was 12% (table 2).
All Private Hospitals, Separations
PATIENT DAYS AND AVERAGE LENGTH OF STAY IN HOSPITAL
During 2002-03, 6.7m patient days were provided in private acute and psychiatric hospitals, down 1% from 2001-02.
The average length of stay for all patients (same-day and overnight-stay) in private acute and psychiatric hospitals remained steady at 3.2 days, which has gradually decreased from 4.2 days in 1992-93.
For overnight-stay patients only, the average length of stay dropped to 5.5 days from 5.6 days in 2001-02 (table 1).
PATIENT CHARACTERISTICS
Age and sex
Females accounted for 55% of all separations from private acute and psychiatric hospitals and 58% of separations from private free-standing day hospital facilities during 2002-03 (table 28). Overall, there were 145 separations per 1,000 population for females compared with 118 separations per 1,000 population for males.
Persons aged 65 years and over accounted for 35% of all separations from private acute and psychiatric hospitals and 33% of separations from private free-standing day hospital facilities during 2002-03 (table 28).
Insurance status
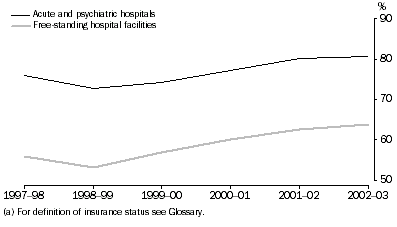
During 2002-03, 81% of admitted patient separations from private acute and psychiatric hospitals carried hospital insurance. This proportion is an increase of 1% over 2001-02 and continues to increase from the low point of 73% recorded in 1998-99 (table 27).
Similarly for free-standing day hospital facilities, 64% of admitted patient separations carried hospital insurance, an increase of 1% over 2001-02 with the proportion steadily increasing from the low point of 53% in 1998-99 (table 27).
The proportion of patient separations covered by hospital insurance for all private hospitals was 78%, marginally higher than the 77% of patient separations covered by hospital insurance in 2001-02 (table 27).
All Private Hospitals, Hospital insurance (a)
Procedures performed
For 2002-03 there were 5.6 million procedures performed on the 2.6 million patients admitted to private hospitals. Of these procedures, 4.6 million were performed in acute and psychiatric hospitals and the remainder in free-standing day hospital facilities (table 30).
For acute and psychiatric hospitals, non-invasive, cognitive and interventions, accounted for 42.7% of all procedures performed in 2002-03, up from 40.5% in the previous year. Examples of cognitive and non-invasive interventions are services such as dietary education and exercise therapy (often used for development of treatment plans, programs, case reviews or follow up to previous procedures performed). For further details of the classification refer to Volume 3 International Statistical Classification of Diseases and Related Health Problems, 10th Revision-Australian Modification (ICD-10-AM).
The next most common procedures in acute and psychiatric hospitals were on the digestive system (11%), the musculoskeletal system (6.6%) and dermatological and plastic procedures (4.5%).
For private free-standing day hospital facilities, non-invasive, cognitive and interventions, nec accounted for 37.5% of all procedures performed on patients in 2002-03, with procedures on the digestive system (22.4%), dermatological and plastic procedures (8.4%) and the eye and adnexa (8.0%) being the other relatively more frequent procedures (table 30).
STAFF
The number of full-time equivalent staff employed at private acute and psychiatric hospitals in Australia during 2002-03 was 45,600, a decrease of 2% from the previous year (table 1). The average number of staff per occupied bed remained at 2.5 (table 10).
During 2002-03, there were approximately 2,000 full-time equivalent staff in free-standing day hospital facilities, an increase of 9% over the previous year (table 2). This continues the upward trend of recent years.
INCOME
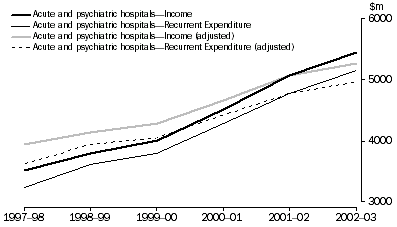
Income received by private acute and psychiatric hospitals in Australia during 2002-03 amounted to $5,456m, an increase of 8% over the previous year. Over the five years to 2002-03, the average annual increase in income was 9% (table 1). When costs are adjusted to remove the effects of price changes over the period, the increases are 4% from the previous year and a 6% average annual increase over the five years to 2002-03. (See Explanatory Notes paragraph 16, concerning chain volume measures.)
Acute and Psychiatric Private Hospitals, Income and expenditure
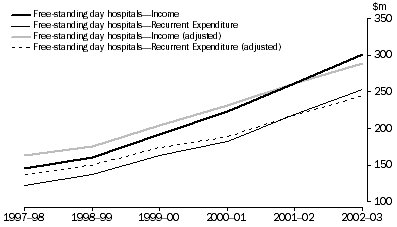
Free-standing day hospital facilities received $301m in income during 2002-03. This was a 15% increase on the previous year, consistent with a 16% average annual increase in income over the five years to 2002-03 (table 2). In adjusted terms these increases were 11% and 12%, respectively. (See Explanatory Notes, paragraph 16, concerning chain volume measures.) The increases in income reflect the continuing growth in patient activity for both private acute and psychiatric hospitals, and private free-standing day hospitals, over the last year, and the expansion in available facilities.
Private Free-standing Day Hospital Facilities, Income and expenditure
EXPENDITURE
Recurrent expenditure for acute and psychiatric hospitals during 2002-03 amounted to $5,147m, an 8% increase over the previous year. Over the five years to 2002-03, the average annual increase in recurrent expenditure was 10% (7% when adjusted for price changes over the period) (table 1). (See Explanatory Notes, paragraph 16, concerning chain volume measures).
For private acute and psychiatric hospitals, wages and salaries (including on-costs such as employer contributions to superannuation and payroll tax) as a proportion of recurrent expenditure has decreased from 55% in 2001-02 to 53% in 2002-03. This proportion has continued to decrease from 61% in 1992-93 (table 1). Other large components were drug, medical and surgical supplies (24% of total) and administrative expenses (8%) (table 14).
The average expenditure per patient day in 2002-03 was $763 compared with $703 in 2001-02. These average costs have increased from $552 in 1997-98 (table 1).
The average cost per patient day continues to increase as hospital size increases. This is a reflection of the greater complexity of procedures undertaken at the larger hospitals. The more complex procedures necessitate greater use of highly trained staff, expensive equipment, drugs and medical supplies. In 2002-03, recurrent expenditure per patient day at private acute and psychiatric hospitals with over 200 beds was $895 compared with the average of $490 for hospitals with 25 or fewer beds (table 16).
There are also considerable differences in the average recurrent expenditure per patient day among the various hospital types. Religious or charitable hospitals had the highest average costs per patient day ($848) in 2002-03 (table 15). Other non-profit hospitals and hospitals operated for profit had lower average costs per patient day ($730 and $710, respectively). A higher proportion of religious or charitable hospitals are large hospitals (more than 200 beds).
Gross capital expenditure for private acute and psychiatric hospitals during 2002-03 decreased 35% from the previous year to $290m, significantly lower than the record high of $528m during 1998-99 (table 1). Capital expenditure in 2002-03 represented 5% of the total income for the year.
Recurrent expenditure recorded for free-standing day hospital facilities in 2002-03 was $254m. This represents an increase of 16% over the previous year (12% when adjusted for price changes) and mirrors the average annual increase over the five year period to 2002-03. The average expenditure per patient separation increased from $506 in 2001-02 to $539 in 2002-03 (table 2). Gross capital expenditure for free-standing day hospital facilities during 2002-03 was $24m (table 2).
NET OPERATING MARGIN
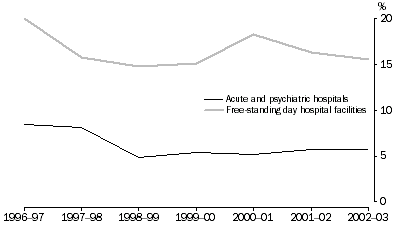
Net operating margin is derived by subtracting recurrent expenditure from income and expressing the result as a proportion of income. The net operating margin for acute and psychiatric hospitals during 2002-03 was 6%, steady at the level of the previous year but above the margin for the five years to 2002-03 of 5%. For free-standing day hospital facilities, the net operating margins were much higher. In 2002-03, the margin was 16%, in line with both the margin for the previous year and for the five years to 2002-03.
All Private Hospitals, Net Operating Margin
 Print Page
 Print All