MAIN FEATURES
SCHOOLS
In August 2005, there were 9,623 schools in Australia, of which 6,929 (72.0%) were government schools and 2,694 (28.0%) were non-government schools.
In 2005 71.5% of all non-special schools were primary only, 15.9% were secondary only and 12.6% were combined primary/secondary schools. In 1995 these proportions were 73.7%, 16.6% and 9.7% respectively. Over the decade this equates to a decrease of 305 in the number of primary or secondary schools, and an increase of 266 in the number of combined primary/secondary schools.
STUDENTS
In 2005 there were 3,348,139 full-time school students. The proportion of these students attending government schools was 67.1%, down from 71.0% in 1995.
From 1995 to 2005, the number of full-time students attending government schools grew by 1.7% (from 2,207,853 to 2,246,087), while the number attending non-government schools increased by 22.2% (from 901,484 to 1,102,052).
There were 25,073 part-time school students in 2005, a decrease of 4.1% since 2004. The Northern Territory (NT) had the highest proportion of part-time students (3.0%), followed by South Australia (SA) with 2.7% and Tasmania (Tas.) with 2.3%.
In 2005 there were 135,097 Indigenous full-time school students, a 3.5% increase since 2004. Almost 58% of these students attended schools in New South Wales (NSW) or Queensland (Qld) in 2005. There were 3,427 Indigenous full-time students in Year 12, across all States and Territories, in 2005, compared to 2,620 five years earlier.
AGE PARTICIPATION RATES
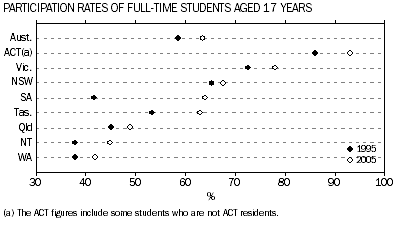
At the Australian level, the age participation rates for full-time school students in 2005 were 94.7% for 15-year-olds, 82.6% for 16-year-olds and 63.5% for 17-year-olds, the latter rising from 58.6% in 1995.

APPARENT RETENTION RATES
In 2005 the apparent retention rate of full-time school students from Year 7/8 to Year 12 was 75.3% compared to 75.7% in 2004 and 72.2% in 1995. As in previous years, the apparent retention rate for females (81.0%) was significantly higher than the rate for males (69.9%).
Apparent retention from Year 10 to Year 12 is down 0.7 percentage points between 2004 and 2005, while over the last decade it has increased from 73.4% in 1995 to 76.5% in 2005. The Year 10 to Year 12 rate for females in 2005 was again considerably higher than that for males (81.6% and 71.5% respectively).
Apparent retention rates for Indigenous full-time school students, from Year 7/8 to both Year 10 and Year 12, have continued to rise over the last five years — the rate to Year 10 increased from 83.0% in 2000 to 88.3% in 2005, and the rate to Year 12 increased from 36.4% to 39.5%. These Indigenous retention rates are lower than the comparable rates for non-Indigenous students. In 2005, the rate to Year 10 for non-Indigenous school students was 98.6%, while the rate to Year 12 was 76.6%.
STAFF
There were 235,794 full-time equivalent (FTE) teaching staff in 2005, 156,564 at government schools and 79,231 at non-government schools. This was an overall increase of 1.2% from the previous year, and 16.5% (33,394) higher than in 1995.
The number of FTE teaching staff in government schools has increased by 8.9% since 1995 compared to 35.2% in the non-government sector. In the year to August 2005, government FTE school teacher numbers increased by 0.3% and non-government FTE school teacher numbers grew by 3.0%.
The proportion of FTE teaching staff who are female continues to rise — in 2005, 68.0% of all FTE teachers were female. The figure was 79.7% in primary schools and 56.0% in secondary schools. The comparable figures in 1995 were 64.2%, 76.1% and 52.3% respectively.
Overall, the average number of FTE primary school students per FTE teacher was 16.2. In government schools the average was 16.1 and in non-government schools it was 16.6. The equivalent figure for secondary schools was 12.2, with an average of 12.4 in government schools and 11.9 in non-government schools.
 Print Page
 Print All