POPULATION
BIRTHS AND CONFINEMENTS
DEATHS
MIGRATION
MARRIAGES
DIVORCES
REGIONAL SUMMARY
NOTES
OVERVIEW
This electronic product provides a demographic overview of Western Australia, 2003. It contains summary tables and commentary on trends in the components of population change including births, deaths and migration. Marriages, divorces, estimated resident population and various demographic rates are also presented. Population and migration data are for the year ended 30 June 2003, while births, deaths, marriages and divorces data are for the year ended 31 December 2003.
For comparisons between the states and territories of Australia, please refer to Demography, Australia, 2003 (cat. no. 3311.0.55.001). Demography publications for each state and territory can be accessed from the following links:
Additional state demographic data are also available from publications and data cubes linked at the foot of this page. The Demography Theme Page provides links to other Australian as well as international demographic statistics. The National Regional Profiles provide economic and social statistics of Statistical Local Areas and Local Government Areas of Australia.
INQUIRIES
For further information about these and related statistics, contact the National Information and Referral Service on 1300 135 070 or Janet Gunn on Perth (08) 9360 5377.
SUMMARY COMMENTARY
INTRODUCTION
At 30 June, 2003, Western Australia's population was 1.95 million which was 9.8% of the Australian population. Western Australia has been the fourth most populous state since 1982. Western Australia had 10% of all births in Australia, 9% of all deaths and 9% of all marriages. In 2003, Western Australia recorded a net loss through interstate migration. Of all overseas arrivals, 11% settled in Western Australia.
POPULATION
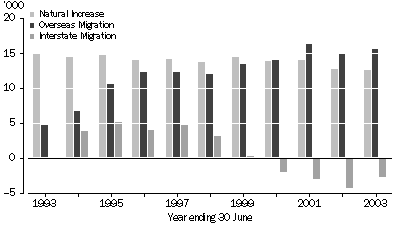
The Estimated Resident Population of Western Australia at 30 June 2003 was 1.95 million, which was 9.8% of the Australian total. The main contributors to population growth in 2003 were net overseas migration (15,600) and natural increase (12,600). During the year to June 30, Western Australia experienced a net loss of 2,800 persons through interstate migration. Western Australia remained the second fastest growing state/territory in 2002-03, with a growth rate of 1.3%, Queensland had the highest growth rate of 2.4%.
Net overseas migration has been the main source of population growth since 2000.
POPULATION COMPONENTS, Western Australia - 1993-2003

POPULATION, Western Australia - Selected years at 30 June |
|
 |  |  | 1993 | 2002 | 2003 |
|
| Estimated resident population | ('000) | 1,677.7 | 1,924.6 | 1,949.9 |
| Components of population change(a) |  |  |  |  |
 | Natural increase(b) | no. | 14,804 | 12,809 | 12,630 |
 | Net overseas migration(c) | no. | 4,640 | 14,970 | 15,575 |
 | Net interstate migration | no. | -152 | -4,385 | -2,810 |
| Total increase(d) | no. | 19,624 | 23,394 | 25,395 |
| Annual growth rate | % | 1.18 | 1.23 | 1.32 |
| Estimates resident households(e) | ('000) | 617.4 | (f)nya | (f)nya |
|
| nya not yet available |
| (a) From previous year. |
| (b) Births and deaths figures used to compile natural increase for population estimates are based on year of occurrence and may differ from births and deaths data based on year of registration displayed in the Births and Confinements and Deaths sections of this table. |
| (c) Until 1997 net overseas migration data for Jervis Bay, Christmas Island and Cocos (Keeling) Island were randomly allocated to the states and territories. For these years the sum of the components may therefore not equal net overseas migration. |
| (d) Includes intercensal discrepancy not accounted for by natural increase and net migration. |
| (e) 1993 figures are based on 1996 census, figures from 1997 on are based on 2001 census. |
| (f) Data is under review. |
BIRTHS AND CONFINEMENTS
In 2003, there were 23,900 confinements resulting in 24,300 births registered to mothers usually residing in Western Australia. Registrations of births during 2003 were 3% higher than in 2002 (23,600 births) and 3% lower than in 1993 (25,100 births). There were 12,500 male births and 11,800 female births registered in 2003, giving a sex ratio of 105.3 males per 100 females. The crude birth rate for Western Australia was 12.4 births per 1,000 estimated resident population, which was slightly lower than the national rate of 12.6.
The total fertility rate (TFR), the average number of babies that a woman could expect to give birth to in her lifetime if she experienced current age-specific fertility rates, was 1.74 babies per woman in 2003. Since 1975, TFRs have been below the rate of 2.1 babies per woman, which is the rate required for replacement of the population.
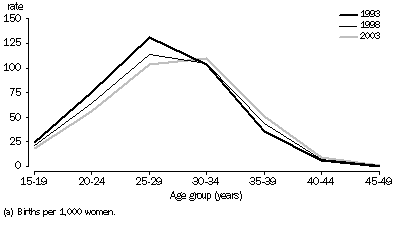
The upward trend in median age of parents continued in 2003, to a high of 30.2 years for mothers and 32.4 years for fathers, reflecting the tendency for couples to have children later in life. The 30-34 year age group had the highest fertility rate at 109.5 babies per 1,000 women in 2003.
AGE-SPECIFIC FERTILITY RATES(a), Western Australia - Selected years

BIRTHS AND CONFINEMENTS(a), Western Australia - Selected years |
|
 |  |  | 1993 | 2002 | 2003 |
|
| Live births |  |  |  |  |
 | Number | no. | 25,081 | 23,601 | 24,273 |
 | Crude birth rate(b) | rate | 14.9 | 12.3 | 12.4 |
 | Total fertility rate(c) | rate | 1.879 | 1.697 | 1.739 |
 | Net reproduction rate(d) | rate | 0.898 | 0.817 | 0.838 |
| All confinements |  |  |  |  |
 | Number | no. | 24,725 | 23,232 | 23,874 |
 | Median age of mother(e) | years | 28.7 | 29.9 | 30.2 |
| Nuptial confinements |  |  |  |  |
 | Number | no. | 17,812 | 15,059 | 15,228 |
 | Median age of mother(e) | years | 29.7 | 31.1 | 31.4 |
 | Median age of father(e) | years | 32.0 | 33.3 | 33.5 |
| First nuptial confinements |  |  |  |  |
 | Number | no. | 6,868 | 6,180 | 6,280 |
 | Median age of mother(e) | years | 28.3 | 30.1 | 30.3 |
|
| (a) Compiled on year of registration basis. |
| (b) Births per 1,000 population. |
| (c) Births per woman. |
| (d) Daughters surviving to reproductive age per woman. |
| (e) The age at which half the population is older and half is younger. |
DEATHS
In 2003, there were 11,300 registered deaths for persons usually resident in Western Australia, an increase of 10% from 1993 when there were 10,300 deaths. There were 5,900 male deaths and 5,400 female deaths. Despite the ageing of the population, there has been a slight decline in the crude death rates over the last 10 years. The crude death rate (CDR) was 5.8 deaths per 1,000 estimated resident population in 2003, compared with 6.1 in 1993. Western Australia's CDR was lower than the national rate of 6.7. The CDR for males (6.1) has been slightly higher than that for females (5.5) in the last decade, even though the male population has a younger age structure than the female population.
Standardised death rates (SDRs) enable comparison of death rates between populations with different age structures. In 2003, Western Australia's SDR of 6.2 was lower that the national rate of 6.4, with only the Australian Capital Territory recording a lower SDR (5.8). In 2003, the male SDR was 7.7 and the female SDR was significantly lower at 5.1.
In 2003, life expectancy at birth for Western Australian usual residents was 78.1 years for males and 83.0 years for females, slightly above the national averages of 77.8 and 82.8 years respectively. Compared with ten years ago, life expectancy at birth in Western Australia improved by 3.1 years for males and 1.9 years for females.
DEATHS(a), Western Australia - Selected years |
|
 |  |  | 1993 | 2002 | 2003 |
|
| Number | no. | 10,316 | 11,326 | 11,311 |
| Crude death rate(b) | rate | 6.1 | 5.9 | 5.8 |
| Standardised death rate(c) | rate | 8.0 | 6.4 | 6.2 |
| Median age at death(d) |  |  |  |  |
 | Males | years | 72.6 | 75.4 | 75.5 |
 | Females | years | 79.8 | 81.8 | 82.1 |
| Infant deaths |  |  |  |  |
 | Number | no. | 147 | 102 | 100 |
 | Infant mortality rate(e) | rate | 5.9 | 4.3 | 4.1 |
| Life expectancy at birth |  |  |  |  |
 | Males | years | 75.0 | 77.9 | 78.1 |
 | Females | years | 81.1 | 82.9 | 83.0 |
|
| (a) Compiled on year of registration basis. |
| (b) Deaths per 1,000 population. |
| (c) Deaths per 1,000 standard population. Standardised death rates have been revised using the 2001 standard population. |
| (d) The age at which there are as many people dying above the age as there are below it. |
| (e) Deaths per 1,000 live births. |
MIGRATION
Overseas migration includes permanent and long-term (over 12 months) movement between Australia and other countries. Net overseas migration refers to net permanent and long-term overseas migration, adjusted for changes in traveller duration intention and errors associated with multiple movements during long-term stays or absences. In 2003, net overseas migration contributed an additional 15,600 persons to the Western Australian population, 600 more than in 2002. Since 1993 net overseas migration has more than tripled.
Western Australia's net interstate migration has fluctuated over the past 20 years, peaking at 9,400 in 1986 and declining to a net loss of 4,400 in 2002. In 2003 Western Australia's net loss from interstate migration was 2,800 people. Although Western Australia has recorded net interstate migration losses since 2000, the state recorded an average gain over the ten years to June 2003 due to gains in the earlier part of the decade.
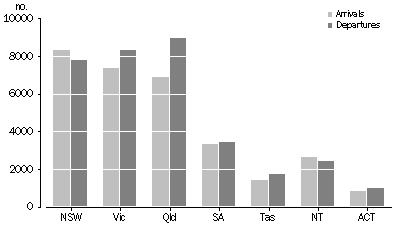
In 2003, Western Australia had a net gain of 530 people from New South Wales and 60 people from the Northern Territory. Western Australia experienced net losses to all other states and territories during the year. Queensland was the most popular destination, followed by Victoria.
INTERSTATE MIGRATION MOVEMENTS, Western Australia - at 30 June 2003

MIGRATION, Western Australia - Selected years at 30 June |
|
 |  |  | 1993 | 2002 | 2003 |
|
| Overseas migration |  |  |  |  |
 | Permanent and long-term movement(a) |  |  |  |  |
 | Arrivals | no. | 22,476 | 38,645 | 42,615 |
 | Departures | no. | 14,304 | 21,338 | 21,413 |
 | Net overseas migration(b) | no. | 4,640 | 14,970 | 15,575 |
| Interstate migration |  |  |  |  |
 | Arrivals | no. | 29,634 | 28,956 | 30,898 |
 | Departures | no. | 29,786 | 33,341 | 33,708 |
 | Net Interstate migration | no. | -152 | -4,385 | -2,810 |
|
| (a) Based on stated intention on arrival or departure. |
| (b) Figures for year ending 30 June 1993 include an adjustment for category jumping. For years ending 30 June 2002 and 2003, figures have been adjusted for changes in traveller intention and multiple mover error. |
MARRIAGES
In 2003, there were 9,500 marriages registered in Western Australia, this was 9% lower than the number registered in the previous year. Total marriages registered in 2003 were 13% fewer than the record number of 11,000 marriages registered in 2000. The crude marriage rate (the number of marriages per 1,000 of the estimated resident population) for Western Australia was 4.9 in 2003, this compares with a national rate of 5.4.
The median age for brides in 2003 was 29.5 years and for bridegrooms it was 31.8 years. This compares with median ages of 26.5 years and 29.3 for brides and bridegrooms respectively in 1993 and reflects the continuing tendency to marry later in life.
MARRIAGES, Western Australia - Selected years |
|
 |  |  | 1993 | 2002 | 2003 |
|
| Number registered | no. | 10,382 | 10,484 | 9,549 |
| Crude marriage rate(a) | rate | 6.2 | 5.4 | 4.9 |
| Median age at marriage(b) |  |  |  |  |
 | Bridegroom | years | 29.3 | 31.6 | 31.8 |
 | Bride | years | 26.5 | 29.3 | 29.5 |
|
| (a) Marriages per 1,000 population. |
| (b) The age at which there are as many people marrying above the age as there are below it. |
DIVORCES
In 2003, there were 5,700 divorces granted in Western Australia and the crude divorce rate was 2.9 divorces per 1,000 population. This rate is slightly higher than the national crude divorce rate of 2.7. Over the last 10 years, the crude divorce rate has remained fairly stable moving between 2.7 and 2.9.
Duration of marriage is the interval between the date of marriage and the date the divorce was made absolute. In 2003, the median duration of marriage in Western Australia was 13.2 years, 1.7 years longer than in 1993. This is the highest median duration of marriage since the passage of the Family Law Act in 1975.
DIVORCES, Western Australia - Selected Years |
|
 |  |  | 1993 | 2002 | 2003 |
|
| Number granted | no. | 4,654 | 5,252 | 5,685 |
| Crude divorce rate(a) | rate | 2.8 | 2.7 | 2.9 |
| Median duration of marriage |  |  |  |  |
 | To separation | years | 8.0 | 9.1 | 9.4 |
 | To divorce | years | 11.5 | 12.8 | 13.2 |
|
| (a) Divorces per 1,000 population. |
REGIONAL SUMMARY
The Perth Statistical Division, which contained 73% of the Western Australian population, had 72% of the State's births and 73% of the State's deaths in 2003. The Perth Statistical Division's average total fertility rate over the three years 2001-2003 (1.64 births per woman) was less than the three-year average for the remainder of the State (2.01 births per woman).
In Western Australia, the largest populations tended to be in those Statistical Local Areas (SLAs) on the fringe of the Perth Statistical Division. The most populous Statistical Local Area in Western Australia was Joondalup - South with an estimated resident population of 107,000 persons. Other SLAs within the Perth Statistical Division with high populations were Stirling - Central (99,800), Melville (97,300), Swan (89,500), Gosnells (87,300), Canning (78,800), Rockingham (78,600), Cockburn (72,400), and Stirling - Coastal (63,100).
The largest SLA outside the Perth Statistical Division was Mandurah with a population of 54,300 persons.
DEMOGRAPHIC SUMMARY,(a)(b), Western Australia - 2003 |
|
 |  | Estimated resident population(c) | Births(d) | Total fertility rate(e) | Deaths(d) | Indirect standardised death rate(f) |
 |  | no. | no. | rate | no. | rate |
|
 |  |  |  |  |  |
 | Perth | 1,431,498 | 17,526 | 1.64 | 8,227 | 6.1 |
 | South West | 203,940 | 2,232 | 1.87 | 1,362 | 6.4 |
 | Lower Great Southern | 53,762 | 673 | 2.05 | 364 | 6.4 |
 | Upper Great Southern | 18,542 | 264 | 2.43 | 136 | 7.2 |
 | Midlands | 53,258 | 632 | 2.22 | 302 | 6.4 |
 | South Eastern | 54,886 | 892 | 2.13 | 244 | 8.6 |
 | Central | 60,251 | 817 | 2.09 | 342 | 7.1 |
 | Pilbara | 39,482 | 635 | 2.08 | 88 | 8.0 |
 | Kimberley | 34,329 | 565 | 1.93 | 189 | 10.6 |
 |  |  |  |  |  |
| Western Australia(g) | 1,949,948 | 24,273 | 1.72 | 11,311 | 6.3 |
|
| (a) The statistical area boundaries used in the compilation of these statistics are those in existence at 1 July 2003. |
| (b) Cells in this table have been randomly adjusted to avoid the release of confidential data. |
| (c) As at 30 June 2003. |
| (d) Data is for calendar year 2003. |
| (e) The average total fertility rate is calculated over the three years 2001 to 2003. |
| (f) The average indirect standardised death rate is calculated over the three years 2001 to 2003. |
| (g) This includes births and deaths where usual residence was overseas, no fixed abode and Western Australia undefined. |
Demographic data for all Western Australian SLAs are available from the data cube linked at the foot of this page.
RELATED LINKS
The following releases provide more specific or in-depth analysis and information.
 Print Page
 Print All