NOTES
ABOUT THIS PUBLICATION
This electronic product, Divorces, Australia (cat. no. 3307.0.55.001) provides information on divorces granted in Australia. Key indicators of national and state divorces are included in the analytical commentary below. Detailed divorce tables are available for purchase in a data cube. The data cube can be accessed by scrolling to the bottom of this page and following the data cube link for 2002. A glossary of terms and explanatory notes about divorce statistics can be accessed using the web-links provided on this page.
This product replaces Marriages and Divorces, Australia (cat. no. 3310.0). A summary of changes made to the divorce table structure as it appeared in the 2001 issue of Marriages and Divorces, Australia, compared to the table structure in the data cube of this product, can be found in the appendix linked to this page. Information on marriages from 2003 onwards will be available in the new electronic product, Marriages, Australia (cat. no. 3306.0.55.001).
UNAVAILABILITY OF DATA
Data on the country of birth of the divorcing parties is not available for 2002. It is expected that this data item will be available from 2003.
Post 2001 Estimated Resident Population (ERP) by marital status is not yet available.
DATA NOTES
The ERP at 30 June 2001 and for years prior to this date used in the calculation of crude and age-specific divorce rates in this product are final. ERP at 30 June 2002 is revised (see the Explanatory Notes for information about preliminary, revised and final ERP).
DATA REVISIONS
Relative country of birth data for 2001 (tables 8 and 9 of the data cube) are revised.
Age-specific divorce rates based on the married population (table 3 of the data cube) for 1997 to 2001 are revised and final based on final ERP by marital status. Rates for 1996 have also been revised.
INQUIRIES
For further information about these and related statistics, contact the National Information and Referral Service on 1300 135 070 or Olivia Agius on Canberra 02 6252 6573.
SUMMARY COMMENTARY
DIVORCES GRANTED
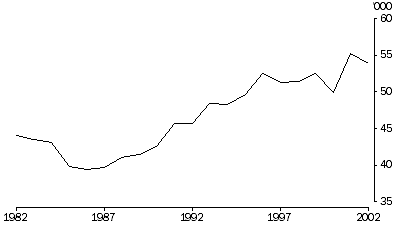
There were 54,000 divorces granted in Australia in 2002, representing a decrease of 2% (or 1,300 divorces) compared with divorces granted in 2001 (55,300). Divorces granted in 2002 were the second highest number granted in the last 20 years, with divorces granted in 2001 being the highest. Divorces in 2002 represent an increase of 18% on the number granted 10 years ago.
Divorces granted

INTRODUCTION OF THE FEDERAL MAGISTRATES COURT, SEPTEMBER 2000
The Family Court of Australia has administered divorce under the Family Law Act 1975 since 1976. In September 2000, the Federal Magistrates Court of Australia (formally known as the Federal Magistrates Service) was established to provide a simpler and more accessible service for litigants and to ease the workload of both the Family Court of Australia and the Federal Court of Australia. The introduction of the Federal Magistrates Court may have had some influence on the decrease in divorces in 2000 and increase in divorces from 2001 onwards (see the Explanatory Notes for more details).
DIVORCE RATES
The crude divorce rate (the number of divorces per 1,000 population) in 2002 was 2.7 per 1,000. This was a decrease on the 2001 rate of 2.9 per 1,000, a slight increase on the rate 10 years ago (2.6 per 1,000).
As the estimated resident population of Australia by marital status for post 2001 years is not yet available, the latest divorce rates based on the married population are for 2001 (see the Explanatory Notes for more detail). The divorce rate of the married population in 2001 was 13.1 per 1,000 married men or women. This represents an increase from the rate of 11.9 per 1,000 married men and 12.0 per 1,000 married women in 2000 and an increase from the rate of 11.6 per 1,000 married men and 11.5 per 1,000 married women in 1991.
LIKELIHOOD TO DIVORCE
Analysis of a net nuptiality table indicates that the expectation to divorce is increasing. If a newly-born group of babies was exposed to 1997-1999 rates of marriage, widowing, divorce, remarriage and mortality, 32% of their marriages would end in divorce. This is an increase on the proportion expected if 1990-1992 rates were applied (29%) and if 1985-1987 rates were applied (28%). For further information, see the Special Article 'Lifetime Marriage Formation and Marriage Dissolution in Australia' p.84 of Marriages and Divorces, Australia, 2000 (cat. no. 3310.0).
AGE AT DIVORCE
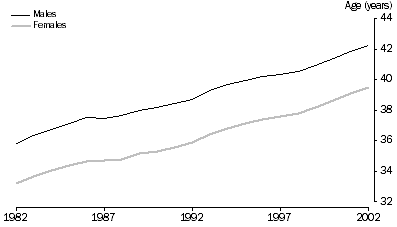
The median age at divorce (the age at which there are as many people divorcing above the age as there are below it) continued to increase in 2002. The median age of men at divorce was 42.2 years, up from 41.8 years in 2001 and 38.7 years in 1992. For women, the median age increased to 39.5 years, up from 39.1 years in 2001 and 35.9 years in 1992. The rise in the median age at divorce is associated with increasing age at first marriage and to some extent the increase in the interval between marriage and divorce. The median age for males at first marriage in 2002 was 29.0 years, up from 28.7 years in 2001 and 26.9 years in 1992. For females, the median age at first marriage in 2002 was 27.1 years, up from 26.9 years in 2001 and 24.7 years in 1992. More information about marriage statistics can be found in Marriages and Divorces, Australia 2002 (cat. no. 3310.0). The increasing interval between marriage and divorce is discussed in the 'duration of marriage to divorce' section of this commentary.
Median age at divorce

RELATIVE AGE OF DIVORCING PARTIES
In 2002, 10% of divorcing couples were of the same age, 68% involved a younger wife and 19% involved a younger husband. Of all divorcing couples, 33% were aged 1-2 years apart, a further 22% were aged 3-4 years apart, and 23% 5-9 years apart. Couples with an age difference of 10 years or more accounted for 10% of divorcing couples. Of these, 9% of couples involved a wife who was 10 or more years younger to her husband.
AGE-SPECIFIC DIVORCE RATES
Males aged 40-44 years experienced the highest divorce rate in 2002 (13.2 per 1,000). In 1992 and 2001, males aged 35-39 years experienced the highest divorce rate ( 13.1 per 1,000 and 13.6 per 1,000 respectively). Females aged 30-34 years experienced the highest divorce rate in 2002 (13.7 per 1,000), 2001 (14.4 per 1,000) and 1992 (13.3 per 1,000).
DURATION OF MARRIAGE FOR DIVORCING COUPLES
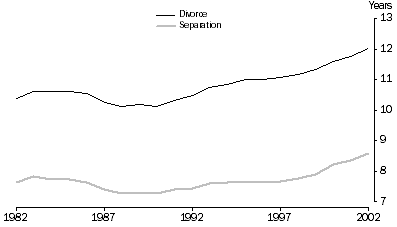
The median duration of marriage to both separation and divorce is increasing over time, revealing that marriages are, on average, lasting longer. The median duration of marriage to separation in 2002 was 8.6 years, up from 8.3 years in 2001 and 7.4 years in 1992. The median duration of marriage to divorce in 2002 was 12.0 years, up from 11.8 years in 2001 and 10.5 years in 1992.
In 2002, 6% of divorces involved separation within the first year of marriage, 33% within the first five years and a further 22% were separated within five to nine years of marriage. Of the divorcing couples in 2002, 16% were married less than five years, 25% were married between five and nine years and 58% were married for 10 years or more. Around 15% of divorces occurred to couples who had been married for 25 years or more.
Median duration to separation and divorce

APPLICANT FOR DIVORCE
As in previous years, more women (45%) than men (30%) lodged applications for divorce in 2002. The remainder of divorces granted in 2002 (26%) were the result of joint applications.
The median duration of marriage to divorce was shorter for female and joint applicants (each 11.4 years) than for male applicants (13.8 years).
DIVORCES INVOLVING DEPENDANT CHILDREN
Over the last 10 years, the proportion of divorces involving children under 18 years has fallen slightly from 53% in 1992 to 51% in 2001 and 50% in 2002. The actual number of children involved in divorce in 2002 (50,500) was down 5% compared with 2001 (53,400) and up 10% compared with 1992 (45,800).
Of divorces involving children in 2002, 36% were those where the age of the youngest child was between five and nine years and for 62% of the divorces that involved children, the age of the youngest child was under 10 years.
COUNTRY OF BIRTH OF DIVORCING PARTIES
Country of birth of divorcing parties is not available for 2002. In 2001, 58% of divorces granted were to couples who were both born in Australia. Divorces to couples born in the same overseas country comprised 13% of divorces granted in 2001, while 29% of divorces were granted to couples who had chosen partners from a different country. Of those couples who had chosen a partner from a different country, 42% were overseas-born men divorcing Australian-born women, and 34% were overseas-born women divorcing Australian-born men.
1. SELECTED DIVORCE INDICATORS, Australia - 1992, 2001 and 2002 |
|
 |  |  |  | 1992 | 2001 | 2002 |
ALL DIVORCES |
|
| Divorces granted | no. | 45,729 | 55,330 | 54,004 |
| Crude divorce rate(a) | rate | 2.6 | 2.9 | 2.7 |
| Median duration of marriage |  |  |  |  |
 | To separation | years | 7.4 | 8.3 | 8.6 |
 | To divorce | years | 10.5 | 11.8 | 12.0 |
| Divorces involving dependant children |  |  |  |  |
 | Divorces | no. | 24,215 | 28,345 | 26,820 |
 | Proportion of all divorces | % | 53.0 | 51.2 | 49.7 |
 | Dependant children | no. | 45,782 | 53,396 | 50,509 |
| Relative birthplace of parties(b) |  |  |  |  |
 | Both born in Australia | no. | 25,619 | 32,139 | na |
 | Both born overseas | no. | 5,673 | 7,235 | na |
 | Born in different countries | no. | 14,121 | 15,433 | na |
| Applicant |  |  |  |  |
 | Husband | no. | 16,470 | 16,608 | 16,114 |
 | Wife | no. | 22,083 | 26,035 | 24,049 |
 | Joint | no. | 7,176 | 12,687 | 13,841 |
HUSBAND |
|
| Age-specific divorce rates(c) |  |  |  |  |
 | Age groups (years) |  |  |  |  |
 |  | 24 and under | rate | 1.0 | 0.5 | 0.4 |
 |  | 25-29 | rate | 8.6 | 6.2 | 5.5 |
 |  | 30-34 | rate | 12.7 | 12.4 | 11.5 |
 |  | 35-39 | rate | 13.1 | 13.6 | 13.1 |
 |  | 40-44 | rate | 11.8 | 13.3 | 13.2 |
 |  | 45-49 | rate | 10.2 | 12.1 | 12.1 |
 |  | 50-54 | rate | 7.6 | 9.9 | 9.5 |
 |  | 55 and over | rate | 2.4 | 3.5 | 3.5 |
| Median age of husband |  |  |  |  |
 | At marriage | years | 25.0 | 26.5 | 26.7 |
 | At separation | years | 35.8 | 38.4 | 38.9 |
 | At divorce | years | 38.7 | 41.8 | 42.2 |
WIFE |
|
| Age-specific divorce rates(c) |  |  |  |  |
 | Age groups (years) |  |  |  |  |
 |  | 24 and under | rate | 2.4 | 1.3 | 1.2 |
 |  | 25-29 | rate | 12.5 | 10.0 | 8.9 |
 |  | 30-34 | rate | 13.3 | 14.4 | 13.7 |
 |  | 35-39 | rate | 12.5 | 13.9 | 13.6 |
 |  | 40-44 | rate | 10.8 | 12.8 | 12.7 |
 |  | 45-49 | rate | 8.6 | 10.6 | 10.4 |
 |  | 50-54 | rate | 5.5 | 7.4 | 7.3 |
 |  | 55 and over | rate | 1.1 | 1.8 | 1.9 |
| Median age of wife |  |  |  |  |
 | At marriage | years | 22.4 | 24.0 | 24.2 |
 | At separation | years | 33.0 | 35.7 | 36.2 |
 | At divorce | years | 35.9 | 39.1 | 39.5 |
|
| na not available |
| (a) Per 1,000 estimated resident population. |
| (b) Excludes divorces where country of birth of one or both partners is not stated. Country of birth not available for 2002. |
| (c) Per 1,000 estimated resident males or females. Males under 18 years and females under 16 years are excluded from the population. |
2. SELECTED DIVORCE INDICATORS, States and territories - 2002 |
|
 |  |  | NSW | Vic. | Qld | SA | WA | Tas. | NT | ACT(a) | Aust. |
|
| Divorces granted | no. | 16,957 | 12,987 | 10,920 | 4,409 | 5,252 | 1,386 | 516 | 1,577 | 54,004 |
| Crude divorce rate(b) | rate | 2.6 | 2.7 | 2.9 | 2.9 | 2.7 | 2.9 | 2.6 | np | 2.7 |
| Duration of marriage |  |  |  |  |  |  |  |  |  |  |
 | To separation | years | 7.8 | 8.7 | 8.7 | 9.8 | 9.1 | 9.8 | 7.2 | 9.6 | 8.6 |
 | To divorce | years | 11.2 | 12.0 | 12.2 | 13.4 | 12.8 | 13.0 | 11.3 | 13.0 | 12.0 |
| Divorces involving dependant children |  |  |  |  |  |  |  |  |  |  |
 | Divorces | no. | 7,409 | 6,747 | 5,748 | 2,441 | 2,756 | 723 | 177 | 819 | 26,820 |
 | Proportion of all divorces | % | 43.7 | 52.0 | 52.6 | 55.4 | 52.5 | 52.2 | 34.3 | 51.9 | 49.7 |
 | Dependant children | no. | 13,643 | 12,743 | 10,971 | 4,591 | 5,246 | 1,374 | 337 | 1,604 | 50,509 |
| Applicant |  |  |  |  |  |  |  |  |  |  |
 | Husband | no. | 5,167 | 4,135 | 3,106 | 1,286 | 1,326 | 423 | 160 | 511 | 16,114 |
 | Wife | no. | 7,345 | 5,884 | 5,103 | 2,133 | 2,127 | 655 | 180 | 622 | 24,049 |
 | Joint | no. | 4,445 | 2,968 | 2,711 | 990 | 1,799 | 308 | 176 | 444 | 13,841 |
| Median age of husband |  |  |  |  |  |  |  |  |  |  |
 | At marriage | years | 27.0 | 26.6 | 26.7 | 26.2 | 26.6 | 26.4 | 27.5 | 26.4 | 26.7 |
 | At separation | years | 38.5 | 38.6 | 39.1 | 39.7 | 39.1 | 39.7 | 38.3 | 39.1 | 38.9 |
 | At divorce | years | 41.8 | 42.0 | 42.5 | 42.9 | 42.9 | 43.1 | 42.3 | 42.4 | 42.2 |
| Median age of wife |  |  |  |  |  |  |  |  |  |  |
 | At marriage | years | 24.5 | 24.3 | 24.1 | 23.8 | 24.1 | 23.7 | 25.0 | 24.0 | 24.2 |
 | At separation | years | 35.8 | 36.0 | 36.2 | 37.0 | 36.5 | 36.9 | 35.8 | 36.1 | 36.2 |
 | At divorce | years | 39.1 | 39.4 | 39.6 | 40.4 | 40.0 | 40.1 | 39.6 | 39.7 | 39.5 |
|
| np not available for publication but included in totals where applicable, unless otherwise indicated |
| (a) Due to the large number of divorces granted in the ACT to persons usually resident in another state, numbers shown for the ACT are not representative of divorce in the ACT population. |
| (b) Per 1,000 estimated resident population. |
 Print Page
 Print All