NOTES
ABOUT THIS PUBLICATION
This issue contains revised estimates of the resident population of Australian states and territories as at 30 June 2003 and preliminary estimates as at 30 June 2004. These are based on the 2001 Census of Population and Housing.
In commentary based on the statistics in this publication, it is recommended that the relevant statistics be rounded. All data are affected by errors in reporting and processing. No reliance should be placed on statistics with small values.
INQUIRIES
For further information about these and related statistics, contact the National Information and Referral Service on 1300 135 070 or Rachael Hill on Canberra (02) 6252 6296.
SUMMARY OF FINDINGS
INTRODUCTION
In the 12 months to 30 June 2004, the Australian population increased by 238,700 people reaching 20,111,300. The annual growth rate for the year ended 30 June was 1.2%, remaining consistent with past years.
All states and territories experienced positive population growth in the year ended June 2004. Queensland recorded the highest growth (2.1%) followed by Western Australia (1.7%), Victoria (1.2%), Tasmania (1.0%), New South Wales and the Northern Territory (each 0.7%), South Australia (0.5%) and the Australian Capital Territory (0.2%).
AGEING POPULATION
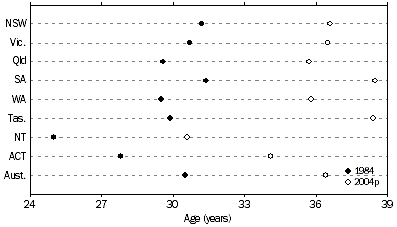
Australia's population is ageing through sustained low levels of fertility, resulting in proportionally fewer children in the population, and increasing life expectancy. The median age (the age at which half the population is older and half is younger) of the Australian population has increased by 5.9 years over the last two decades, from 30.5 years at 30 June 1984 to 36.4 years at 30 June 2004. Between 30 June 2003 and 2004 there was an increase of 0.2 years.
South Australia and the oldest population
At 30 June 2004, South Australia recorded the oldest population of all the states and territories with a median age of 38.5 years. Tasmania was the second oldest with a median age of 38.4 years, followed by New South Wales (36.6 years), Victoria (36.5 years), Western Australia (35.8 years), Queensland (35.7 years), the Australian Capital Territory (34.1 years) and the Northern Territory (30.6 years).
Median Age of population, At 30 June

Tasmania experienced the greatest increase in median age over the last 20 years, increasing from 29.9 years in 1984 to 38.4 years in 2004.
AGE STRUCTURE
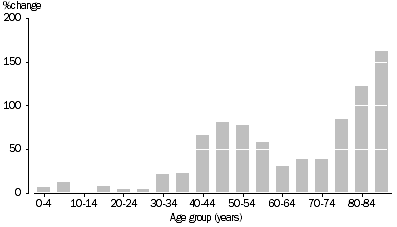
Population change, Age group - 1984 to 2004p

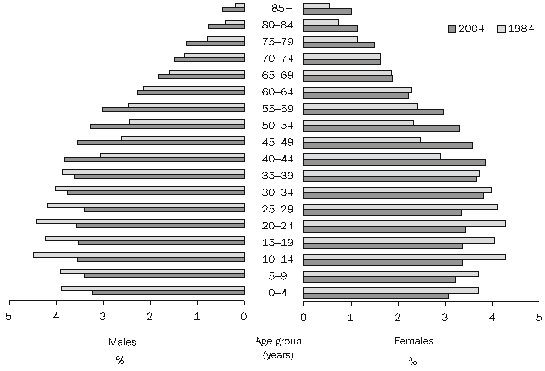
Between 30 June 1984 and 30 June 2004, the proportion of population aged 15-64 years has remained relatively stable, increasing from 66% to 67% of the total population. The proportion of people aged 65 years and over has increased from 10.1% to 13.0%. During the same period, the proportion of the population aged under 15 years of age decreased from 24.0% to 19.8%.
Population, Age and sex - 1984 and 2004p

CHILDREN (UNDER 15 YEARS OF AGE)
There was a slight decrease (-590 persons) in the number of children aged under 15 years in Australia in the 12 months to 30 June 2004. The increase in the number of children aged 10-14 years of 7,700 persons in the year ended June 2004 was offset by decreases of 8,000 children in the 5-9 year age group and 340 children in the 0-4 year age group. This reflects Australia's declining fertility with the total fertility rate falling from 1.84 children per women in 1984 to 1.75 in 2003.
Queensland recorded the largest percentage increase in the number of children aged 0-14 years (0.8%) in the year ended June 2004. The Northern Territory and Western Australia also recorded positive growth in 0-14 year olds (each up 0.3%). The Australian Capital Territory recorded the largest percentage decrease in population aged 0-14 years (down 1.4%), followed by South Australia (down 0.7%), New South Wales (down 0.4%) and Tasmania (down 0.3%), while Victoria experience little change.
ADULTS
In the year ended June 2004, Australia's adult population (people aged 15 years and over) increased by 239,200 people (1.5%). This growth was unevenly distributed across the age groups of the population. For example, the growth rate for those aged 15-44 years (0.7%) was below that of the 45 years and over age group (2.4%).
Aged 15-64 years
The number of people aged 15-64 years increased by 1.4% in the year ended June 2004. Queensland (2.4%) and Western Australia (1.8%) each recorded growth rates for 15-64 year olds higher than the national average. Victoria (1.4%) recorded the same growth rate and the remaining states and territories all experienced increases below the national average; Tasmania (1.2%), New South Wales (0.9%), South Australia (0.6%), the Northern Territory (0.5%) and the Australian Capital Territory (0.2%).
Aged 65 years and over
For the year ended June 2004, the number of people aged 65 years and over in Australia increased by 58,500 people (2.3%) and reached just over 2.6 million. This age group comprised 13% of the total Australian population.
Population aged 65 years or more, Proportion and Growth |
|  |
 | Proportion of population in 2004 | Population growth in 2003-2004 |  |
| State | % | % |  |
|  |
| New South Wales | 13.5 | 1.8 |  |
| Victoria | 13.3 | 2.1 |  |
| Queensland | 12.0 | 3.2 |  |
| South Australia | 15.0 | 1.6 |  |
| Western Australia | 11.6 | 3.3 |  |
| Tasmania | 14.3 | 2.1 |  |
| Northern Territory | 4.4 | 6.3 |  |
| Australian Capital Territory | 9.3 | 3.5 |  |
| Australia | 13.0 | 2.3 |  |
|  |
In June 2004, all states and territories experienced growth in their populations aged 65 years and over. The Northern Territory (6.3%), the Australian Capital Territory (3.5%) and Western Australia (3.3%) experienced the greatest increase in the numbers of persons aged 65 years and over.
Aged 85 years and over
In the year to June 2004, the number of people aged 85 years and over increased by 11,800 people or 4.1%, to reach 298,300. Over the past two decades, the number of elderly people has increased by 163%, compared with total population growth of 29% over the same period. Increased life expectancy for both males and females has contributed to this rise. Reflecting higher life expectancy at birth for females compared with males, there were over twice as many females (203,500) than males (94,800) in this age group at 30 June 2004.
In the year ended June 2004, the largest increases in the number of people aged 85 years and over occurred in the Australian Capital Territory (6.8%), followed by the Northern Territory (5.9%), Queensland (5.0%), New South Wales (4.4%), South Australia (4.1%), Western Australia (3.5%), Victoria (3.4%) and Tasmania (2.6%).
INTERNATIONAL COMPARISON
The trend toward population ageing is established in many countries. For example, in countries such as Italy, Japan, Greece the number of people aged 65 years and over already exceeds the number of children aged 0-14 years. Population ageing in general is a result of sustained low fertility rates coupled with relatively high life expectancy and increasing longevity. In Australia, based on the latest Series B population projections, the number of people aged 65 years and over is projected to exceed the number of children aged 0-14 years around the year 2016. For more information, see Population Projections, Australia, 2002 to 2101 (cat. no. 3222.0).
According to United Nations projections, all countries selected for analysis in Table 2 are expected to experience decreases in the proportion of children in their populations between 2000 and 2005. In the majority of these countries, the decrease in children aged 0-14 years is expected to be accompanied by increases in the proportions of people aged 15-64 years and/or people aged 65 years and over. Countries such as Italy, Japan and Greece are expected to experience proportional declines in their populations aged 15-64 years as well as their populations aged 0-14 years, and are expected to experience large proportional increases in their population aged 65 years and over.
Population age structure, International comparison |
|  |
 | 2000
| 2005(a)
|  |  |  |
 | Aged 0-14 years | Aged 15-64 years | Aged 65 years and over | Median Age | Aged 0-14 years | Aged 15-64 years | Aged 65 years and over | Median Age | Total fertility rate(b) | Life expectancy(c) |  |
| Selected countries | % | % | % | years | % | % | % | years | rate | years |  |
|  |
| Australia | 20.7 | 66.9 | 12.4 | 35.4 | 19.5 | 67.4 | 13.1 | 36.7 | 1.8 | 79.2 |  |
| Canada | 19.0 | 68.4 | 12.6 | 36.9 | 17.3 | 69.4 | 13.2 | 38.9 | 1.5 | 79.3 |  |
| China (exl. SARs and Taiwan) | 24.8 | 68.3 | 6.8 | 30.0 | 21.8 | 70.6 | 7.5 | 32.4 | 1.8 | 71.0 |  |
| France | 18.8 | 65.2 | 16.0 | 37.6 | 18.4 | 65.3 | 16.3 | 38.9 | 1.9 | 79.0 |  |
| Greece | 15.1 | 67.4 | 17.5 | 39.1 | 14.3 | 66.7 | 19.0 | 40.8 | 1.3 | 78.3 |  |
| Hong Kong (SAR of China) | 16.6 | 72.7 | 10.6 | 36.1 | 14.6 | 73.9 | 11.4 | 38.6 | 1.0 | 79.9 |  |
| India | 34.1 | 60.9 | 4.9 | 23.4 | 31.9 | 62.8 | 5.3 | 24.5 | 3.0 | 63.9 |  |
| Indonesia | 30.9 | 64.3 | 4.8 | 24.6 | 28.7 | 65.9 | 5.5 | 26.2 | 2.4 | 66.8 |  |
| Italy | 14.3 | 67.6 | 18.1 | 40.2 | 13.9 | 66.6 | 19.6 | 42.2 | 1.2 | 78.7 |  |
| Japan | 14.6 | 68.2 | 17.2 | 41.3 | 14.0 | 66.3 | 19.7 | 42.8 | 1.3 | 81.6 |  |
| Korea, Republic of | 20.9 | 72.0 | 7.1 | 31.8 | 19.4 | 71.8 | 8.8 | 34.4 | 1.4 | 75.5 |  |
| Malaysia | 33.7 | 62.2 | 4.1 | 23.6 | 32.3 | 63.1 | 4.6 | 24.8 | 2.9 | 73.1 |  |
| New Zealand | 22.9 | 65.3 | 11.8 | 34.5 | 21.8 | 66.0 | 12.1 | 36.0 | 2.0 | 78.3 |  |
| Papua New Guinea | 41.5 | 56.1 | 2.4 | 19.1 | 40.3 | 57.2 | 2.5 | 19.7 | 4.1 | 57.6 |  |
| Philippines | 37.5 | 58.9 | 3.5 | 20.9 | 35.0 | 61.1 | 3.9 | 22.2 | 3.2 | 70.0 |  |
| Singapore | 21.8 | 71.1 | 7.2 | 34.5 | 19.6 | 72.0 | 8.4 | 37.5 | 1.4 | 78.1 |  |
| South Africa | 34.0 | 62.3 | 3.7 | 22.6 | 32.2 | 63.5 | 4.2 | 23.3 | 2.6 | 47.7 |  |
| Sweden | 18.3 | 64.3 | 17.4 | 39.6 | 17.0 | 65.3 | 17.7 | 41.0 | 1.6 | 80.1 |  |
| United Kingdom | 19.1 | 65.1 | 15.9 | 37.7 | 17.9 | 66.1 | 15.9 | 38.8 | 1.6 | 78.2 |  |
| United States of America | 21.8 | 65.9 | 12.3 | 35.2 | 21.2 | 66.5 | 12.3 | 35.9 | 2.1 | 77.1 |  |
| Viet Nam | 33.4 | 61.3 | 5.3 | 23.1 | 29.4 | 65.2 | 5.4 | 24.9 | 2.3 | 69.2 |  |
|  |
| (a) International data are United Nations medium variant projections. Australian data are ABS medium series (Series B) projections. |
| (b) Births per woman. United Nations medium variant projections for the period 2000-2005. |
| (c) Life expectancy at birth. United Nations medium variant projections for the period 2000-2005, for males and females combined. |
| United Nations World Population Prospects, 2002 Revision; ABS Estimated Resident Population; ABS, Population Projections, Australia, 2002 to 2101 (cat. no. 3222.0) |
According to Australian Bureau of Statistics projections, the proportion of children in the Australian population is expected to decline by more than one percentage point between 2000 and 2005, from 20.7% in to 19.5%, while the proportion of people aged 15-64 years is expected to increase by half a percentage point from 66.9% to 67.4%. The proportion of people aged 65 years and over is expected to increase by less than one percentage point from 12.4% to 13.1%.
In 2000, the age structure of Australia's population was similar to that of Canada and the United States of America. Generally, the European countries and Japan had smaller proportions of children and higher proportions of older people than Australia. In contrast, countries from the Asian region tended to have proportionally more children and far fewer older people, generally reflecting considerably higher fertility rates and lower life expectancies at birth than those experienced in Australia.
 Print Page
 Print All