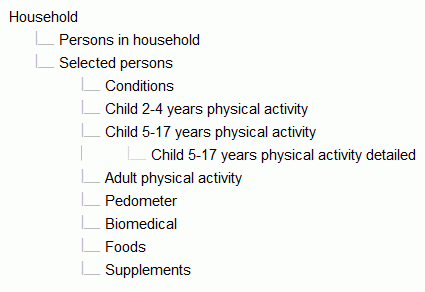
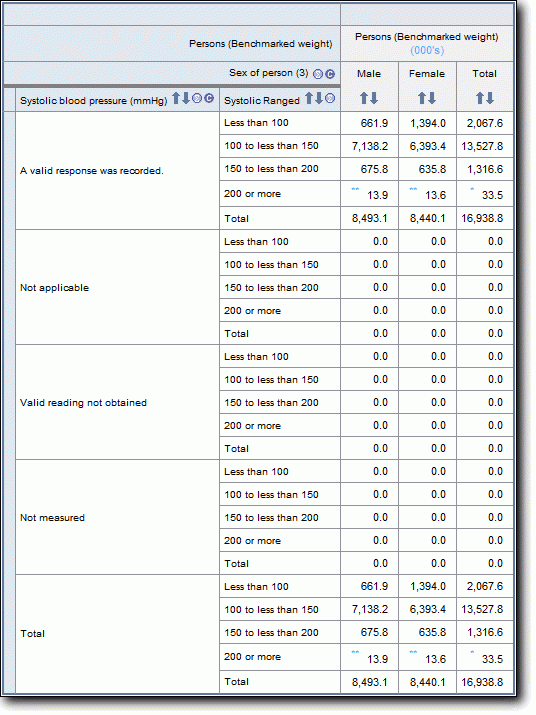
Much of the important data from the food and supplement level has already been copied to the person level. The person level file contains data items summing a person's nutrient intake for day one total, day one food only, day one supplements only, day two total, day two food only and day two supplements only. These are provided for each of the 44 nutrients (however, there are no supplement totals for nutrients not measured on the supplement level).
The following SAS code is an example of copying information from a lower level to a level above:
PROC SORT DATA=NPA11BF;
BY ABSPID;
DATA TTLBREAD (KEEP=ABSPID BRDT1 BRDT2);
SET NPA11BF;
BY ABSPID;
RETAIN BRDT1 BRDT2;
IF FIRST.ABSPID THEN DO; BRDT1=0; BRDT2=0; END;
IF THRDIGC=122 AND ENERGYWF>0 AND DAYNUM=1 THEN BRDT1=SUM(BRDT1,ENERGYWF); /*sums the energy with dietary fibre intake for each record in the food group 'regular breads, and bread rolls (plain/unfilled/untopped varieties)' for day 1*/
IF THRDIGC=122 AND ENERGYWF>0 AND DAYNUM=2 THEN BRDT2=SUM(BRDT2,ENERGYWF); /*sums the energy with dietary fibre intake for each record in the food group 'regular breads, and bread rolls (plain/unfilled/untopped varieties)' for day 2*/
IF LAST.ABSPID THEN OUTPUT;
PROC SORT DATA=NPA11BP;
BY ABSPID;
DATA MRGFILES;
MERGE TTLBREAD NPA11BP;
BY ABSPID;
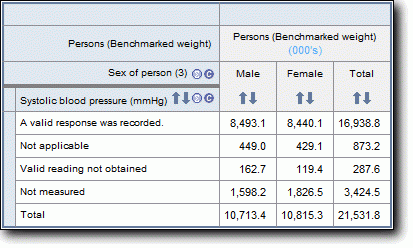
PROC FREQ DATA=MRGFILES; /*This procedure gives a weighted count of the data copied up from the food level*/
TABLES BRDT1 BRDT2;
WEIGHT NPAFINWT;
RUN;
The new data items BRDT1 and BRDT2 are a sum of the energy with dietary fibre of regular breads, and bread rolls (plain/unfilled/untopped varieties) for each person per day of intake. So they are meaningful on the person level, where only one value per record is produced for each variable. If a person has no day two intake then BRDT2=0. Merging the new data items onto the person level allows them to be analysed with any other items on the person level and for weighted estimates to be correctly produced.
The following SAS code is an example of copying information from a higher level to a level below:
PROC SORT DATA=NPA11BS;
BY ABSPID;
PROC SORT DATA=NPA11BP;
BY ABSPID;
DATA MRGFILES;
MERGE NPA11BS NPA11BP (KEEP=ABSPID ABSHID AGEC SEX);
BY ABSPID;
RUN;
This merge matches one person record to many supplement records. So, the data items copied from the person level ('AGEC' and 'SEX' in the example) will be repeated for the counting unit of the level they have been added to, supplements in this case.