|
|
|
Social attachment is important to progress, but difficult to define and measure. Rather than present a single indicator, this commentary presents some measures which illustrate changing social attachment in Australia. |
People are social beings. They require love, companionship and agreeable engagements with others (including those that involve the formal exchange of goods and services) to flourish. The absence of family, friendship or other caring or cooperative social relationships at any stage of life, but particularly when people are least able to care for themselves, can have a serious impact on personal wellbeing. And there are often high costs to the wider community associated with assisting people with poor or broken social relationships, or the absence of social support.
'Social attachment' refers to the nature and strength of relationships that people have with each other. It includes the more intimate relationships with family and friends as well as people’s associations with individuals and organisations in the wider community. More generally, it refers to the way in which people bond, interact with, and feel about other people, organisations and institutions (such as clubs, business organisations, political parties, and various government organisations). At social attachment's opposite extreme lie notions of social detachment, social isolation and social exclusion.(SEE FOOTNOTE 1)
There is no conceivable single indicator that captures all that might be important. Therefore a selection of indicators is presented relating to various activities/behaviours or situations that reflect on social attachment. The indicators describe people's participation in various social activities, their propensity to form or break away from intimate social relationships (indicated through marriage and divorce rates), and their likelihood of living alone. Others, such as suicide and drug related death rates, focus on outcomes of low levels of attachment. These indicators do not describe the 'health' of communities per se and is a weakness of the current list of indicators. Moreover, there will undoubtedly be debate about the appropriateness and comprehensiveness of any set of indicators chosen; social attachment is a particular dimension on which the ABS will be seeking feedback. There is also international work taking place on measurements of social attachment and associated concepts which will feed into a review of this dimension before the next issue of Measuring Australia's Progress.
SOCIAL ATTACHMENT AND RELATED CONCEPTS
Closely related to the concept of social attachment is the notion of 'social capital'. Social capital, for which there are various definitions, embodies the concept of social attachment. But it also recognises that the stock of positive beliefs and values - such as altruism and tolerance - that facilitate social cooperation within a community, are important to societal wellbeing. Aspects of social co-operation are discussed further in the commentary Governance, democracy and citizenship.
DESIRED DIRECTIONS OF CHANGE
Individual views about ideal levels of social attachment vary. Nonetheless, for some aspects of social attachment, people can generally agree whether change in a particular direction is good or bad. For instance, most agree that decreases in the suicide rate, in the incidence of drug-related deaths, or in the level of homelessness, represent improvements. But for many other aspects of social attachment, the choice and interpretation of indicators may be considered to be laden with the values of those involved in the selection or interpretation of those indicators.
Families have long been viewed as the core social unit that serves to maintain people's welfare. Over recent decades, the emphasis of debate has shifted from the maintenance of the ideal family form (earlier viewed as the so-called traditional family involving a married couple and their children), to one in which the quality of relationships between family members, irrespective of form, is viewed as being more important. Yet, to members of the community who hold on to traditional values, the decline of traditional family structures may be viewed as regress.
Well established research suggests that there are positive health outcomes, such as greater longevity, from having high quality relationships with close family members and friends. It also suggests that other aspects of life (such as employment outcomes) are better for people with wide social networks.(SEE FOOTNOTE 2) |
WHAT DO THE INDICATORS SHOW?
It is important to recognise that the data which follow have come from a number of different sources and, depending on data availability, they relate to different periods in time.
PATTERNS OF PARTICIPATION IN VARIOUS SOCIAL ACTIVITIES ARE CHANGING
- Involvement in paid employment provides an important means of meeting people and developing close relationships with others. As noted in the commentary Work: Looking more closely, there have been changes in the levels of labour force participation of both men and women (decreasing for men and increasing for women) which suggests that women have more work-related social engagements than in the past, and that for men levels of social attachment through work have decreased. However, there are important aspects of social attachment outside of the work situation, which may also be changing conversely, as women in employment have less time available for other community activities and as men can engage in other activities outside the work context.
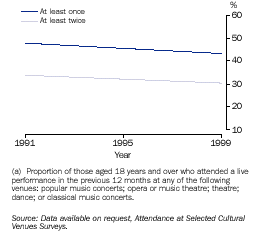
- The likelihood of people going out to attend a live performance (specifically including venues involving: a popular music concert; opera or music theatre; theatre; dance; or classical music concerts) as a member of an audience, has declined slightly. Between 1990 and 1999, those aged 18 years or over, attending a live performance at least once in the previous twelve months, declined from 48% to 43%. The proportion attending a performance on two or more occasions in each twelve month period declined from 34% to 30%. Data relating to people’s attendance at sporting events are not available for the same time period. However, between 1995 and 1999, the proportion of people aged 15 years and over who attended a sporting event, match or competition at least once during the year before being interviewed remained the same at 43%.(SEE FOOTNOTE 3)
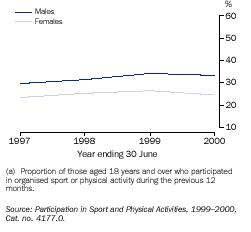
- Levels of participation in organised sports or physical activities (i.e. as a member of a team or club) among people aged 18 years and over have been changing over recent years. But as the data are only available for four years
(i.e. 1996-97 to 1999-2000) and there have been both upward and downward shifts in the rates, the longer term trend is not clear. Over the three year period 1996-97 to 1998-99 the overall level of participation in such activities increased from 27% to 30%, but between 1998-99 and 1999-2000 it stabilised at about 30%. While women had lower participation rates than men (25% compared to 33% in 1999-2000) the changes over time were similar for both groups.
- The likelihood that people will voluntarily give their time to do some work for an organisation or group is often regarded as one of the stronger measures of social attachment, as it involves assisting others. Between 1995 and 2000, the proportion of people aged 15 years and over who reported that they did some voluntary work during the previous
12 months increased from 24% to 32%. The increases occurred for both sexes and across all age groups, but were proportionately greater for those in the age groups 18-24 years (17% to 27%) and 55-64 years
(24% to 33%). (SEE FOOTNOTE 4)
Attending live performances(a)
| Participating in organised sports(a)
|
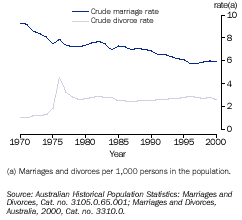
Marriage and divorce
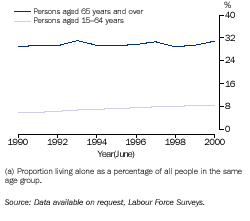
| Persons living alone(a)
|
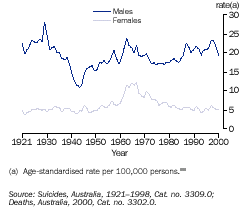
Suicide deaths(a)
|
|
HOMELESSNESS
Homelessness may also be seen as an indicator of adverse levels of social attachment. Homeless people are without settled accommodation and do not have access to the economic and social support that a home normally affords. Of course, there are many, often interrelated, personal and situational factors that may cause people to become or remain homeless. These include family breakdown, drug abuse, gambling, mental health problems, domestic violence and poverty.
People experiencing homelessness can stay in any number of places, including sleeping rough, staying in stop gap accommodation (with friends or in community refuges for those in crisis situations) or in other low cost accommodation (such as rooms in boarding houses). As a result it is very difficult to measure the numbers of people involved. Nevertheless, there have been some attempts to provide authoritative estimates. Those prepared by Chamberlain and the ABS, based on the 1996 Census of Population, showed some 105,000 homeless people in Australia on census night (August 1996).(SEE FOOTNOTE 6) The estimate prepared by researchers of the Consilium Group, using different methodologies but very similar definitions of homelessness to those used in the Chamberlain/ABS study and pertaining to June 1997, was smaller (53,000 people).(SEE FOOTNOTE 7)
There are no reliable time series data to say whether the numbers have been changing over time. Information obtained from community organisations providing crisis accommodation and support services (compiled by the Australian Institute of Health and Welfare) indicate that greater numbers of clients received daily support in 2000-01 (about 15,500 to 16,500 per day) than in 1996-97 (about 13,000 to 14,000 per day).(SEE FOOTNOTE 8) But these numbers are understood to represent only a fraction of homeless people in Australia on any one day, and cannot by themselves be taken as reliable evidence of deteriorating levels of social attachment. |
MARRIAGE LESS POPULAR AND DIVORCE PATTERNS CHANGING
- The commitment to a formal marriage (in a church or by a civil celebrant) has become less popular. In 1970, the crude marriage rate stood at 9.3 marriages per 1,000 people. Between 1990 and 2000 the crude marriage rate declined from 6.9 to 5.9 marriages per 1,000 people, a continuation of a longer term trend.
- Although many people now choose to live together in de facto marriages, people are increasingly likely to live without a partner at all. Comparisons from the 1986 and 1996 Censuses of Population and Housing show that the proportion of adults who did not have a partner (in either a legal marriage or a de facto marriage relationship) increased from 33% to 37%. The change was greater for younger people (those in the 18-34 year age range), but the proportion of people who were not living with a partner increased for each age group under 55 years.(SEE FOOTNOTE 5)
- The dissolution of legal marriages through divorce has contributed to the increase in the proportion of people not living with a partner. However, while divorce rates increased over the decade or so up to 1996, the data indicate a decline in divorce rates over more recent years. This needs to be viewed in the context of the decline in the number of registered marriages.
- Divorce rates in Australia were affected significantly by the introduction of the Family Law Act 1975, which made it easier to obtain a divorce. The Act allows only one ground for divorce, an irretrievable breakdown in a marriage, measured as the separation of spouses for at least one year. The change saw the crude divorce rate jump from less than 1.3 divorces per 1,000 people in the early 1970s to 4.5 divorces in 1976. After several years, while the backlog of applications was processed, the divorce rate settled at a level more than twice that before the introduction of the Act.
- Further changes in the divorce rate occurred through the 1980s and 1990s. From 2.3 divorces per 1,000 people in 1987 there was a slow but continuous increase in the divorce rate, rising to a peak of 2.9 divorces per 1,000 people in 1996. In 2000, the crude divorce rate (2.6 divorces per 1,000 people) was lower than that in the preceding year (2.8 divorces per 1,000 people) and below the longer term peak recorded in 1996.
MORE PEOPLE LIVING ALONE AND TIME SPENT ALONE ALSO INCREASING
- Adults, of all ages, are increasingly more likely to live alone, which is partly a consequence of the changes just described. Between 1990 and 2000, the proportion of people aged 15-64 years who lived alone increased from 5.7% to 8.2%, and among those aged 65 years and over it increased from 29% to 31%.
- Partly associated with more people living alone, people are also more likely to spend their time alone. Between 1992 and 1997, the average waking time per week spent alone among people aged 15 years and over increased from a little under 18½ to a little over 21 hours, an increase of close to 2¾ hours per week. While the increases were greatest for people who lived alone, increases also occurred for people who lived with others. The increases occurred in most age groups, but were typically greater among men than women. (SEE FOOTNOTE 11)
SUICIDE RATES HAVE FLUCTUATED, BUT DRUG RELATED DEATH RATES HAVE INCREASED SINCE THE 1980's
The suicide rate is a widely used indicator of social attachment.(SEE FOOTNOTE 12) The rate is particularly useful for looking at longer term trends because data are available for a long period. While many complex factors might influence a person’s decision to take his or her own life, suicide points to a loss of will to live as part of society and an inability of others to ensure that the person’s sense of wellbeing was maintained. The prevalence of drug-related deaths is used as a measure of social attachment for similar reasons. While such deaths can occur for many reasons, their occurrences point to individuals who may not be well integrated into a supportive community.
- The annual, age standardised, suicide rate has fluctuated substantially over the last century, with the long term ups and downs being more the result of changes in the male suicide rate, which has been more volatile and consistently higher than the female rate. Indeed the female rate was relatively low (between four and seven suicide deaths per 100,000 women) and stable through much of the century. The one exceptional period among females occurred through the mid to late 1960s when female suicide rates increased to between 11 and 12 deaths per 100,000 females. However, after that time, it gradually declined and by 1980 it had returned close to its pre-1960s level, at which it has remained with only relatively small annual variations. In 2000 the female suicide rate was 5.2 per 100,000 females.
Among males, suicide rates reached both their highest and lowest levels in the first half of the century, with a peak in 1930 (28 suicide deaths per 100,000 males) during the time of the Great Depression and a pronounced low occurring during World War II (11 suicide deaths per 100,000 males in 1944). However, the rates for the war years are affected by the fact that troops serving overseas who committed suicide were excluded from the measure.(SEE FOOTNOTE 13)
After World War II the next long term peak occurred in the early to mid 1960s (a little before the time when it was also relatively high for women). The peak year during that time was 1963 when there were 24 suicide deaths per 100,000 males. After falling to lows of around 17 and 18 suicide deaths per 100,000 males through much of the 1970s and early 1980s, the rates increased once more to a peak of 22.5 suicide deaths per 100,000 males in 1987; after some years of volatility in the rates, this was surpassed by a peak of 23.4 suicide deaths per 100,000 males in 1997.
Despite a recent fall in the male suicide rate to 19.4 suicide deaths per 100,000 males in 2000, the general shift from the relatively low rates recorded through the 1970s to higher rates in the late 1980s and 1990s stands in contrast to the downward shift in female rates since the 1970s.
- Drug-related death rates are mostly due to the use of opiates such as heroin. (SEE FOOTNOTE 14) Like suicide, the drug-related death rate for females has been relatively low and stable over the last two decades, but for males the trend has been quite different. Starting at similar levels as for females in 1980 (about five deaths per 100,000 people), by 1990 the male rate had grown close to seven deaths per 100,000. After remaining stable at about the 1990 level for several years, it rapidly doubled to 14 deaths per 100,000 in 1999, falling to 12 deaths per 100,000 males in 2000.
For females, on the other hand, the drug-related death rate at the end of the 20 year period was higher than at the beginning (4.3 and 5.1 per 100,000 females in 1980 and 2000, respectively). The increase among females has also largely occurred over the most recent years, with the rate having fallen during the intervening years to even lower levels than that recorded in 1980.
See also the commentaries Crime, Health, Work, Culture and leisure, and Governance, democracy and citizenship.
FOOTNOTES
1 Berger-Shmitt, R. and Noll, H. 2000, Conceptual Frameworks and Structure of a European System of Social Indicators, EU Reporting Working Paper No. 9, Centre for Social Research and Methodology, Mannheim.
2 Organisation for Economic Co-operation and Development (OECD) 2000, Human and Social Capital and Sustained Growth and Development. Reconciling New Economies and Societies: The Role of Human and Social Capital. DEELSA/ELSA/ED/CERI/CD(2000)3/REV1, OECD, Paris.
3 Australian Bureau of Statistics 1999, Sports Attendance, 1999, Cat. no. 4174.0, ABS, Canberra.
4 Australian Bureau of Statistics 2001, Voluntary Work, 2000, Cat. no. 4441.0, ABS, Canberra.
5 Australian Bureau of Statistics 2000, "People without partners", pp. 43-46 in Australian Social Trends, 2000, Cat. no. 4102.0, ABS, Canberra.
6 Chamberlain C. 1999, Counting the homeless: implications for policy development, Cat. no. 2041.0, ABS, Canberra.
7 Consilium Group 1998, Estimating the number of homeless people in Australia, FaCS, Canberra.
8 Australian Institute of Health and Welfare (AIHW) 2001, SAAP National Data Collection Annual Report 2000-01 Australia. AIHW Cat. no. HOU61, AIHW (SAAP NDCA Report, Series 6), Canberra.
9 Drug-related deaths are those caused directly or indirectly by drug abuse, including deaths from organ damage caused by drugs. They include deaths from illegal drugs as well as the misuse of legal drugs.
Excluded from the death rates presented in this commentary are: deaths directly attributable to alcohol and tobacco use; deaths from poisoning or exposure to volatile organic compounds (such as petrol); and murder where drugs were the weapon. Also excluded are deaths such as some road traffic accidents or AIDS deaths where drug use partly contributed to the death.
Deaths from 1980 to 1998 were classified according to the International Statistical Classification of Diseases Ninth Edition (ICD-9), while deaths from 1999 were classified according to the Tenth Edition (ICD-10). The drug-related deaths from these different classifications have been matched to facilitate comparisons over time.
In this article, drug-related deaths include the following categories from the ICD.10:
- suicide by drugs (X60.X64);
- accidental drug-related deaths, which include two components: accidental poisoning by drugs (X40.X44) and mental and behavioral disorders due to drug use (F11-F16, F19 & F55); and
- drug deaths where the intent of the poisoning was undetermined (Y10.Y14).
10 Standardised death rates enable comparisons of death rates between populations of different age structures by relating them to a standard population. Death rates have been standardised to the 1991 total population.
11 Australian Bureau of Statistics 1999, "Spending time alone", pp. 35-38 in Australian Social Trends, 1999, Cat. no. 4102.0, ABS, Canberra.
12 OECD 2001, Society at a Glance: OECD Social Indicators, OECD, Paris.
13 Australian Bureau of Statistics 1997, Australian Demographic Trends, 1997, Cat. no. 3102.0, ABS, Canberra.
14 For further analysis, see ABS 2001, "Drug-related deaths", pp. 71-74 in Australian Social Trends, 2001,Cat. no. 4102.0, ABS, Canberra.
|
 Print Page
 Print All