FEATURE ARTICLE: AVERAGE QUARTERLY DWELLING COMPLETION TIMES
INTRODUCTION
Over the last 15 years there has been an overall increase in the average amount of time taken to build new houses and townhouses. This article examines the average quarterly completion times for new houses and townhouses from 1995-96 to 2009-10. National data is presented to show changes in the average completion times of new houses and townhouses. Regional data is presented in five year periods to allow for broader comparisons between the States and Territories.
The data presented is from the Australian Bureau of Statistics (ABS) quarterly Building Activity Survey (cat. no. 8752.0). New houses are defined as detached buildings used for long term residential purposes, consisting of only one dwelling unit and are not a result of alterations or additions to a pre-existing building. New townhouses are defined as dwellings with their own private grounds, that are either attached in some structural way to one or more dwellings or are separated from neighbouring dwellings or non-residential buildings by less than 500 millimetres and are not a result of alterations or additions to a pre-existing building. For further information refer to ABS Functional Classification of Buildings, 1999 (cat. no. 1268.0.55.001). Dwellings that took more than three years to complete or were constructed in groups of 10 or more were excluded. As a result, approximately 2.5% of completed houses and townhouses were excluded.
Results
Australian Average Quarterly Completion Times
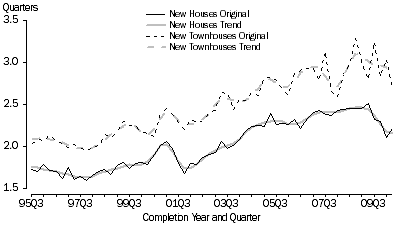
Graph 1 depicts the Australian average completion times, in quarters, for new houses and townhouses from 1995-96 to 2009-10. Both new houses and townhouses have generally increased and have tracked similarly over the past 15 years. The main difference between the two types of residential dwellings is that new houses have had a lower average quarterly completion time than townhouses.
The original average quarterly completion times series for new houses showed steady growth throughout 2007-08 and 2008-09. Average quarterly completion times for new houses peaked at an average completion time of 2.5 quarters in the June quarter of 2009. Since this peak there has been a steep downward trend in average completion times for new houses.
In recent years there has been increased volatility in the average completion times for new townhouses. The original series showed a sharp fall in average quarterly completion times in the December quarter of 2007, followed by several quarters of rapid growth until it peaked at 3.3 quarters in the December quarter of 2008. Since this peak there has been a downward trend for new townhouses.
Graph 1: Average quarterly completion time of new houses and new other residential dwellings, Australia

States and Territories by Five Year Periods
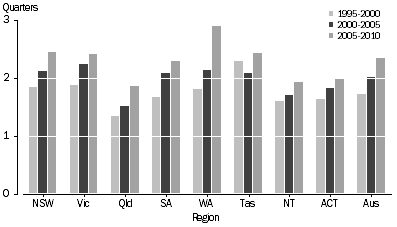
Graph 2 depicts the five year means of the average quarterly completion times of new houses at the State and Territory level. There have been large increases in the average completion times for all States and Territories in the most recent period. Western Australia has seen the largest increase in this period, with an increase of 0.8 quarters from the previous period. Tasmania, on average over the 15 years, experienced the highest average completion times for new houses, while Queensland experienced the lowest.
Graph 2: Average quarterly completion time of new houses, five year means, States, Territories and Australia

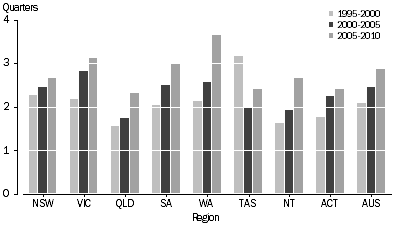
Graph 3 illustrates the five year means of the average quarterly completion times for new townhouses over a 15 year period. Similar to new houses, the most recent period is characterised by increases in completion times. Western Australia experienced the largest increase in average quarterly completion times of 1.1 quarters from the previous period. On average, over the 15 year period, Western Australia experienced the highest average completion times for new townhouses, while Queensland experienced the lowest.
All the States and Territories, excluding Tasmania, experienced increases in average completion time over the 15 year period. Tasmania, however, experienced a fall in average quarterly completion times of 1.2 quarters from the first 5 year period to next.
Graph 3: Average quarterly completion time of new townhouses, five year means, States, Territories and Australia

References
Building Activity, Australlia (cat. no. 8752.0)
ABS Functional Classification of Buildings, 1999 (cat. no. 1268.0.55.001)
 Print Page
 Print All
 Quality Declaration