Technical Note — Seasonally adjusted and trend estimates
Seasonally adjusted and trend estimates add to the understanding of overseas arrivals and departures (OAD) statistics. Seasonally adjusted estimates allow users to analyse short-term movements including irregular impacts on the series, while trend estimates provide a better method to analyse and monitor the underlying direction of the series. In most cases, the trend series is the best source of information on the long-term direction of these statistics.
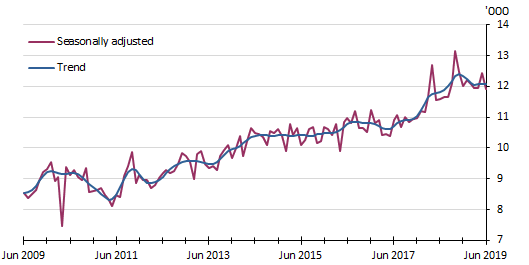
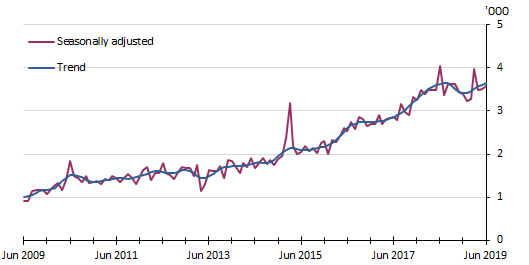
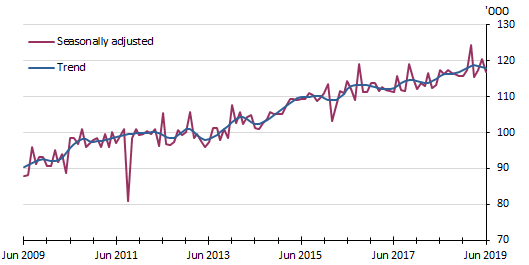
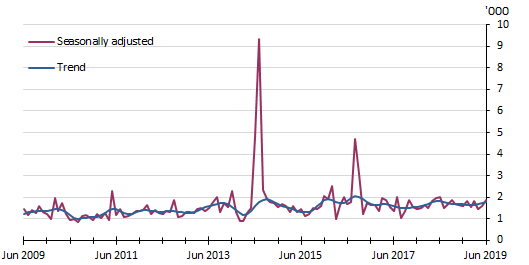
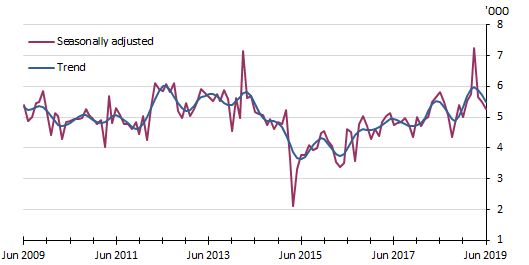
The following graphs are provided to illustrate variations in the seasonally adjusted and trend series for selected countries. These graphs cover the period June 2009 to June 2019.
Overseas visitor arrivals — short-term trips
Selected source countries
The graph for:
- France shows a major change of the seasonally adjusted series in April 2010 with a decrease in travel due to volcanic eruptions in Iceland, which closed major airports in Europe for one week
- Sri Lanka shows one in March 2015 due to increased travel to attend the ICC Cricket World Cup, in which a majority of Sri Lankan games were played in Australia
- New Zealand shows one in September 2011 with more New Zealanders staying home due to New Zealand hosting the 2011 Rugby World Cup.
France — Visitor Arrivals — short-term trips
 Sri Lanka — Visitor Arrivals — short-term trips
 New Zealand — Visitor Arrivals — short-term trips
 Australian resident returns — short-term trips
Selected destinations
The graph for:
- Brazil shows major changes of the seasonally adjusted series due to increased travel by Australians in July 2014, coinciding with the FIFA World Cup and August 2016, coinciding with Olympics held in Rio de Janeiro
- Vanuatu shows one due to decreased travel by Australians in April 2015 after a series of disruptions of air travel due to severe tropical cyclones, most notably Cyclone Pam in March 2015.
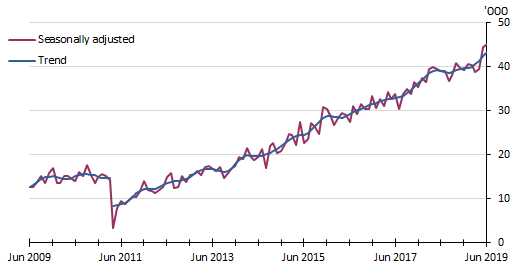
Sometimes there are abrupt and sustained changes in the underlying behaviour of short-term movement series, termed ‘trend breaks’. Given that these occasions can distort trend estimates, the ABS takes such breaks into account when smoothing seasonally adjusted series.
The graph for:
- Japan shows a break in the trend series due to decreased travel by Australians from April 2011 after the major earthquake and tsunami in March 2011 and subsequent radiation exposure incidents.
Brazil — Resident returns — short-term trips
 Vanuatu — Resident returns — short-term trips
 Japan — Resident returns — short-term trips
 Print Page
 Print All
 Quality Declaration