EDUCATION
Definition and scope
The Education industry includes all units mainly engaged in providing education.
ANZSIC Division N, Education, consists of one sub-division:
- Education (sub-division 84).
Sub-division 84 consists of the following groups:
- Group 841 - Preschool education
- Group 842 - School education
- Group 843 - Post school education
- Group 844 - Other education.
Summary of GSP(P) sources and methods
The methodology for Education uses an output indicator approach to compile state by industry GVA estimates. The quantity revaluation method is used to derive state specific education output volumes for all but the latest year when price deflation is used. Education output indicators by state are derived for each level of Education weighted together by the cost of providing those services.
The quantity revalued output indicator uses data on the number of students in preschools, primary and secondary schools obtained from ABS Schools, Australia (cat. no. 4221.0), university data from the Department of Education, Science and Training (DEST) annual report and Vocational Education & Training data from the National Centre for Vocational Education Research (NCVER) annual statistics.
In the latest year, the current price expenditure is price deflated using an education specific price index in the latest year. The public sector current price data are sourced from the ABS Government Finance Statistics, Education, Australia (cat. no. 5518.0.55.001) and private sector current price data are sourced from DEST.
These state output indicators are used to derive volume measures of GVA for Education. The state volume GVAs are then benchmarked to the annual national industry volume GVA.
Results for Education
Education gross value added(a), Chain volume measures(b) |
|  |
 | 2000-01 | 2001-02 | 2002-03 | 2003-04 | 2004-05 | 2005-06 |  |
Values ($m) |  |
|  |
| New South Wales | 11 730 | 11 872 | 12 157 | 12 103 | 12 350 | 12 364 |  |
| Victoria | 9 433 | 9 566 | 9 733 | 9 849 | 9 949 | 10 256 |  |
| Queensland | 6 526 | 6 716 | 6 830 | 7 170 | 7 150 | 7 416 |  |
| South Australia | 2 554 | 2 635 | 2 676 | 2 677 | 2 761 | 2 858 |  |
| Western Australia | 3 239 | 3 299 | 3 219 | 3 264 | 3 311 | 3 279 |  |
| Tasmania | 794 | 801 | 811 | 836 | 850 | 868 |  |
| Northern Territory | 433 | 445 | 437 | 437 | 446 | 455 |  |
| Australian Capital Territory | 987 | 986 | 1 029 | 1 052 | 1 074 | 1 061 |  |
| Australia | 35 690 | 36 315 | 36 898 | 37 382 | 37 891 | 38 556 |  |
Percentage changes from previous year (%) |  |
|  |
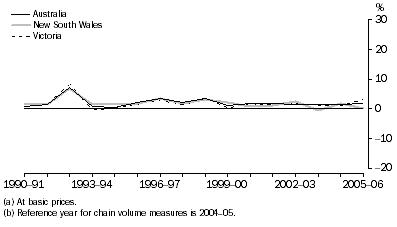
| New South Wales | 0.9 | 1.2 | 2.4 | -0.4 | 2.0 | 0.1 |  |
| Victoria | 1.8 | 1.4 | 1.7 | 1.2 | 1.0 | 3.1 |  |
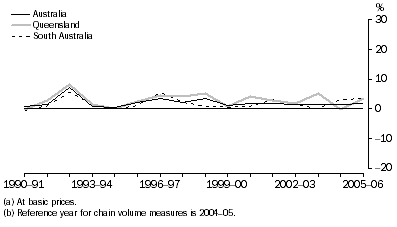
| Queensland | 4.0 | 2.9 | 1.7 | 5.0 | -0.3 | 3.7 |  |
| South Australia | 0.7 | 3.2 | 1.5 | 0.1 | 3.1 | 3.5 |  |
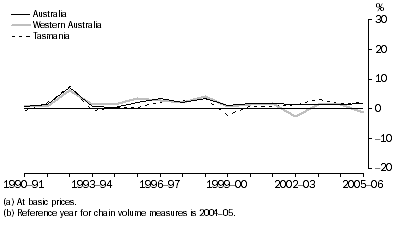
| Western Australia | 1.3 | 1.9 | -2.4 | 1.4 | 1.4 | -1.0 |  |
| Tasmania | 1.0 | 0.9 | 1.3 | 3.1 | 1.8 | 2.1 |  |
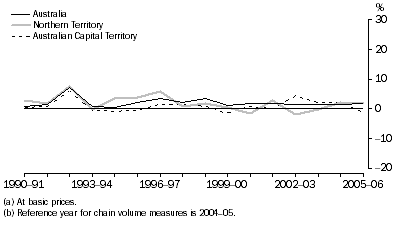
| Northern Territory | -1.4 | 2.8 | -1.8 | - | 2.2 | 2.0 |  |
| Australian Capital Territory | 0.9 | -0.1 | 4.4 | 2.3 | 2.1 | -1.2 |  |
| Australia | 1.7 | 1.8 | 1.6 | 1.3 | 1.4 | 1.8 |  |
|  |
| - nil or rounded to zero (including null cells) |
| (a) At basic prices. |
| (b) Reference year for chain volume measures is 2004-05. |
Education gross value added(a), Chain volume measures(b)-Percentage changes

Education gross value added(a), Chain volume measures(b)-Percentage changes

Education gross value added(a), Chain volume measures(b)-Percentage changes

Education gross value added(a), Chain volume measures(b)-Percentage changes

Education gross value added, State shares - Current prices |
|  |
 | 1989-90 | 1994-95 | 1999-00 | 2003-04 | 2004-05 | 2005-06 |  |
 | % | % | % | % | % | % |  |
|  |
| New South Wales | 33.8 | 33.5 | 33.9 | 32.7 | 32.6 | 32.4 |  |
| Victoria | 27.0 | 26.5 | 25.7 | 26.6 | 26.3 | 26.5 |  |
| Queensland | 15.0 | 16.9 | 17.8 | 18.4 | 18.9 | 18.9 |  |
| South Australia | 8.9 | 8.1 | 8.0 | 7.3 | 7.3 | 7.4 |  |
| Western Australia | 8.8 | 8.9 | 8.5 | 8.7 | 8.7 | 8.6 |  |
| Tasmania | 2.5 | 2.3 | 2.1 | 2.2 | 2.2 | 2.2 |  |
| Northern Territory | 1.1 | 1.1 | 1.2 | 1.1 | 1.2 | 1.3 |  |
| Australian Capital Territory | 2.9 | 2.7 | 2.8 | 2.9 | 2.8 | 2.7 |  |
| Australia | 100.0 | 100.0 | 100.0 | 100.0 | 100.0 | 100.0 |  |
|  |
New South Wales, Victoria and Queensland together accounted for over three quarters of Australian Education GVA in 2005-06. New South Wales and South Australia have lost a marginal amount of share throughout the time series, whilst Queensland has gradually increased its share from 15.0% in 1989-90 to 18.9% in 2005-06. All other states maintained their shares throughout the time series.
 Print Page
 Print All