MAIN FEATURES
POPULATION AND GROWTH
The preliminary estimated resident population (ERP) of Australia at 30 June 2008 was 21,374,000 persons, an increase of 359,000 since 30 June 2007 and 91,400 persons since 31 March 2008. The increase for the year ended 30 June 2008 is the largest recorded for a 12 month period since the ERP concept was introduced in 1971 (see paragraphs 4 to 6 of the Explanatory Notes for more detail).
The annual population growth rate for the year ended 30 June 2008, at 1.71% was the fastest annual growth rate for a year ended 30 June since 1989 (at 1.71%).
COMPONENTS OF POPULATION CHANGE
The growth of Australia's population has two components: natural increase (the number of births minus the number of deaths) and net overseas migration.
Natural Increase
Natural increase for the 12 months ended 30 June 2008 was 145,500 persons, an increase of 4.3% (or 6,000 persons) on the natural increase for the year ended 30 June 2007 (139,500 persons).
BIRTHS
The preliminary estimate for births during the year ended 30 June 2008 (287,500) was 4.8% higher than the figure for the year ended 30 June 2007 (274,300).
The total fertility rate (TFR) for the year ended 30 June 2008 was 1.935.
DEATHS
The preliminary estimate for deaths during the year ended 30 June 2008 (142,000) was the highest ever recorded for a year ending 30 June.
The standardised death rate (SDR) for the year ended 30 June 2008 was 6.03 deaths per 1,000 persons. The infant mortality rate (IMR) for the year ended 30 June 2008 was 4.11 infant deaths per 1,000 live births which is the lowest ever recorded.
Net Overseas Migration
For the year ended 30 June 2008, Australia recorded a preliminary net overseas migration (NOM) estimate of 213,500 persons. This was the difference between 443,200 overseas arrivals that were added to the population (NOM arrivals) and 229,700 overseas departures that were subtracted from the population (NOM departures). The contribution made to population growth by NOM (59.5%) was higher than that of natural increase (40.5%).
AN IMPROVED METHOD FOR CALCULATING NET OVERSEAS MIGRATION
The ABS has introduced an improved method for estimating NOM. This method has been used for September quarter 2006 onwards. Preliminary NOM estimates are based on international movement data for the reference quarter, adjusted by information derived from travellers with the same characteristics from the corresponding quarter two years earlier. Final NOM estimates for the four quarters of 2006-07 (scheduled for release in March 2009) will be based on the actual duration of stay in Australia and overseas of international travellers.
The time series using the previous method for calculating NOM finishes at June quarter 2006. Estimates from this past time series and the current time series are not comparable. For further information see Information Paper: Improved Methods for Estimating Net Overseas Migration (cat. no. 3107.0.55.003); Information Paper: Statistical Implications of Improved Methods for Estimating Net Overseas Migration, Australia 2007 (cat. no. 3107.0.55.005); and the Technical Note Measuring Net Overseas Migration, Method Used September Quarter 2001 to June Quarter 2006 in the March quarter 2007 issue of this publication (cat. no. 3101.0).
STATES AND TERRITORIES: POPULATION AND GROWTH
The estimated resident populations for the states and territories at 30 June 2008 were as follows: New South Wales 6,967,000, Victoria 5,298,000, Queensland 4,279,000, South Australia 1,602,000, Western Australia 2,163,000, Tasmania 498,200, the Northern Territory 219,900 and the Australian Capital Territory 344,200.
All states and territories recorded positive population growth over the 12 months ended 30 June 2008. Western Australia recorded the fastest growth rate (2.7%), followed by Queensland and the Northern Territory (2.3%), Victoria (1.8%), the Australian Capital Territory (1.3%), New South Wales and South Australia (1.1%) and Tasmania (1.0%).
COMPONENTS OF POPULATION CHANGE
At the state and territory level, population growth has three components: natural increase, net overseas migration and net interstate migration.
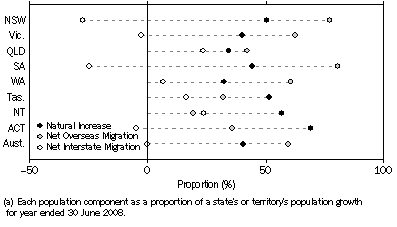
Although all states and territories experienced positive population growth in the year ended 30 June 2008, the proportion that each of these components contributed to population growth varied between the states and territories.
Population Components as proportion of total growth(a) - Year ended 30 June 2008

Natural Increase
As illustrated in the graph above, natural increase was the major component of population growth in the Australian Capital Territory at 69.1% (3,100 persons), the Northern Territory at 56.9% (2,900 persons) and Tasmania at 51.4% (2,500 persons) for the year ended 30 June 2008.
BIRTHS
The number of births registered for the 12 months ended 30 June 2008 increased in comparison with the previous year, in all states and territories except New South Wales. Queensland recorded the largest percentage increase of 10.4%, closely followed by Victoria and Western Australia (8.7% and 8.4% respectively).
DEATHS
The number of deaths registered for the 12 months ended 30 June 2008 increased in comparison with the previous year, in all states and territories. The Northern Territory recorded the largest percentage increase of 13.9%.
Net Overseas Migration
Net overseas migration for the year ended 30 June 2008, as illustrated in the previous graph, was the major component of population growth in South Australia at 80.5% (14,200 persons), closely followed by New South Wales at 77.2% (61,200 persons). This was followed by Victoria at 62.6% (58,000 persons), Western Australia at 60.7% (34,700 persons) and Queensland 42.1% (41,300). All other states and territories experienced positive net overseas migration.
Net Interstate Migration
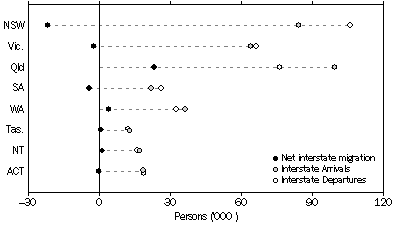
For the year ended 30 June 2008, Queensland experienced the highest positive net interstate migration with a gain of 23,100 persons. Other states and territories that experienced positive net interstate migration were Western Australia (3,800 persons), the Northern Territory (1,200 persons) and Tasmania (790 persons). Negative net interstate migration was experienced by New South Wales (-21,900 persons), South Australia (-4,400 persons), Victoria (-2,500 persons) and the Australian Capital Territory (-220 persons).
Interstate migration, Arrivals, Departures and Net
- States and territories
- Year ended 30 June 2008

INTERNATIONAL COMPARISON
For the 12 months ended 30 June 2008, Australia's population growth rate (1.7%) was higher than that of the world (1.2%). Australia's growth rate was lower than some developing countries including Papua New Guinea (2.2%), the Philippines (2.0%) and Malaysia (1.8%). It was higher than India (1.6%), Indonesia and Singapore (both 1.2%), New Zealand and Viet Nam (both 1.0%), Unites States of America (0.9%), Canada (0.8%), China and France (both 0.6%), Hong Kong (0.5%), Republic of Korea and the United Kingdom (both 0.3%), Greece and Sweden (both 0.2%). Unlike Australia, Italy experienced no change. Further, Japan experienced a decrease in its population (0.1%).
According to figures from the US Bureau of Census' International Data Bank of 226 countries, Australia's population size ranked 55th in 2008 (down from 54th in 2007) and is projected to rank 58th by 2050. By 2050, India is projected to have displaced China as the most populous country with close to one fifth of the world's population at 1.8 billion people.
Population, growth rate and rank - at 30 June(a) |
|  |
 | ESTIMATED POPULATION | PROJECTED POPULATION | RANK |  |
 | 2007 | 2008 | Growth Rate | 2050 | 2008 | 2050 |  |
| Selected Countries | million | million | % | million | no. | no. |  |
|  |
| Australia | 21.0 | 21.4 | 1.7 | 34.0 | 55 | 58 |  |
| Canada | 32.9 | 33.2 | 0.8 | 41.1 | 37 | 44 |  |
| China (exl. SARs and Taiwan) | 1 321.9 | 1 330.0 | 0.6 | 1 424.2 | 1 | 2 |  |
| France | 63.7 | 64.1 | 0.6 | 69.8 | 21 | 24 |  |
| Greece | 10.7 | 10.7 | 0.2 | 10.0 | 74 | 96 |  |
| Hong Kong (SAR of China) | 7.0 | 7.0 | 0.5 | 6.2 | 100 | 117 |  |
| India | 1 129.9 | 1 148.0 | 1.6 | 1 807.9 | 2 | 1 |  |
| Indonesia | 234.7 | 237.5 | 1.2 | 313.0 | 4 | 4 |  |
| Italy | 58.1 | 58.1 | 0.0 | 50.4 | 23 | 36 |  |
| Japan | 127.4 | 127.3 | -0.1 | 93.7 | 10 | 17 |  |
| Korea, Republic of | 48.3 | 48.4 | 0.3 | 43.4 | 25 | 41 |  |
| Malaysia | 24.8 | 25.3 | 1.8 | 43.2 | 46 | 42 |  |
| New Zealand | 4.1 | 4.2 | 1.0 | 5.2 | 124 | 121 |  |
| Papua New Guinea | 5.8 | 5.9 | 2.2 | 10.7 | 106 | 94 |  |
| Philippines | 94.2 | 96.1 | 2.0 | 172.0 | 12 | 11 |  |
| Singapore | 4.6 | 4.6 | 1.2 | 4.6 | 118 | 128 |  |
| Sweden | 9.0 | 9.0 | 0.2 | 9.1 | 88 | 103 |  |
| United Kingdom | 60.8 | 60.9 | 0.3 | 64.0 | 22 | 29 |  |
| United States of America | 301.1 | 303.8 | 0.9 | 420.1 | 3 | 3 |  |
| Viet Nam | 85.3 | 86.1 | 1.0 | 107.8 | 13 | 16 |  |
| World | 6 627.5 | 6 707.0 | 1.2 | 9 539.0 | . . | . . |  |
|  |
| . . not applicable |
| (a) Selected countries include major OECD countries, the world's most populous countries, our closest neighbours and trading partners. |
| Source: Australian estimates, this issue of Australian Demographic Statistics (cat. no. 3101.0); Australian projections, Population Projections, Australia, 2006 to 2101 (cat. no. 3222.0); selected country and world estimates and projections, US Bureau of Census, International Data Base (IDB). |
STATISTICS FOR PARLIAMENTARY REPRESENTATION
It is expected that, in early 2009, the Electoral Commissioner will request that the Australian Statistician provide a set of statistics for an electoral determination in accordance with the
Commonwealth Electoral Act 1918. Population estimates required under section 46 (1B) of the
Commonwealth Electoral Act 1918 are presented in Table 8.
The following table shows the estimated net undercount, and associated standard errors, for the 2006 Census of Population and Housing as required by section 47 of the
Commonwealth Electoral Act 1918. Population estimates have already been adjusted to account for estimated net undercount in the census. For the Northern Territory and the Australian Capital Territory, in circumstances referred to in section 48 of the
Commonwealth Electoral Act 1918, the Electoral Commissioner will add twice the standard error of the estimate of net undercount to each Territory's population, and recalculate its electoral entitlement. For further information see
Information Paper: Determining Seats in the House of Representatives - Legislative Requirements for Provision of ABS Statistics, Australia, 2005 (cat. no. 3107.0.55.002).
2006 Census, Net undercount, standard errors and confidence intervals - NT and ACT |
|  |
| Territory | Net undercount | Standard error | Two standard errors | Lower 95% confidence limit | Upper 95% confidence limit |  |
|  |
| Northern Territory | 15 909 | 3 300 | 6 600 | 9 309 | 22 509 |  |
| Australian Capital Territory | 4 027 | 3 189 | 6 378 | -2 351 | 10 405 |  |
|  |
Source: Table 2.1,
Census of Population and Housing - Details of Undercount, August 2006 (cat. no. 2940.0).
 Print Page
 Print All
 Quality Declaration