MAIN FEATURES
SCHOOLS
In August 2007, there were 9,581 schools in Australia, of which 6,853 (71.5%) were government schools and 2,728 (28.5%) were non-government schools.
In 2007, 70.8% of all non-special schools were primary only, 16.2% were secondary only, and 13.0% were combined primary/secondary schools. In 1997, these proportions were 73.4%, 16.4% and 10.2% respectively. Over the decade this equates to a decrease of 287 in the number of primary or secondary schools, and an increase of 257 in the number of combined primary/secondary schools.
STUDENTS
In 2007, there were 3,416,523 full-time school students. The proportion of these students attending government schools was 66.4%, down from 70.3% in 1997.
From 1997 to 2007, the number of full-time students attending government schools grew by 1.7% (from 2,230,052 to 2,268,377), while the number attending non-government schools increased by 21.9% (from 941,572 to 1,148,146).
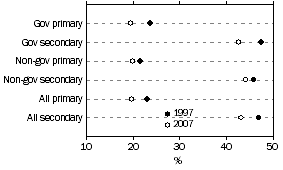
PROPORTION OF NON-GOVERNMENT FULL-TIME STUDENTS

There were 24,503 part-time school students in 2007, 22 less than in 2006. South Australia (SA) had the highest proportion of their students in part-time study (2.8%), followed by Northern Territory (NT) with 2.2% and Tasmania (Tas.) with 2.0%.
In 2007, there were 147,181 Indigenous full-time school students, an increase of 4.8% or 6,800 since 2006. Almost 59% of these students attended schools in New South Wales (NSW) or Queensland (Qld). There were 21,546 Indigenous full-time students in senior secondary schooling (Years 10-12), across all states and territories in 2007, compared to 14,538 in 2002 - an increase of 48.2%.
AGE PARTICIPATION RATES
At the Australian level, the age participation rates for all school students in 2007, were 98.4% for 14-year-olds, 94.5% for 15-year-olds, 84.4% for 16-year-olds and 64.5% for 17-year-olds.
APPARENT CONTINUATION RATES(ACR)
The Apparent Continuation Rate is a measure that describes the movement in the proportions of a population cohort attending school, between one year and the next, expressed as a percentage.
Similar to Retention Rates, it is probably most effective in describing the activity of cohorts in post-compulsory schooling (eg aged 16 and over).
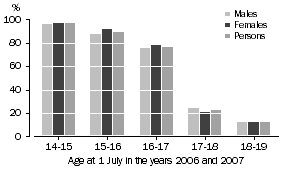
It is estimated that 89.1% of Australians aged 15 in 2006 continued on in school education in 2007 amd 76.6% of Australians aged 16 in 2006 continued on in school education in 2007.
APPARENT CONTINUATION RATES 2006-2007

APPARENT RETENTION RATES
In 2007, the apparent retention rate of full-time students from Year 7/8 to Year 12 was 74.3%, compared to 74.7 % in 2006 and 71.8% in 1997.
The retention rate for females in 2007 was 80.2% and for males 68.8%.
Apparent retention rates for Indigenous full-time students from Year 7/8 to Year 12 are much lower than for non-Indigenous students (42.9% and 75.6%), but 2007 saw the Indigenous rate rise by 2.8 percentage points in comparison to 2006, while the non-Indigenous rate decreased by 0.3 percentage points.
STAFF
There were 244,358 full-time equivalent (FTE) teaching staff in 2007, 160,791 at government schools and 83,567 at non-government schools. This was an overall increase of 2.0% from the previous year, and 18.0% (37,299) higher than in 1997.
The number of FTE teaching staff in government schools increased by 10.5% from 1997 compared to a 35.8% increase in the non-government sector. In the year to August 2007, government FTE school teacher numbers increased by 1.6% and non-government FTE school teacher numbers grew by 2.6%.
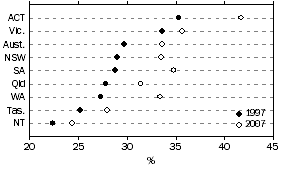
PROPORTIONS OF MALE SCHOOL TEACHERS

The proportion of FTE teaching staff who are female continues to rise - in 2007, 68.7% of all FTE teachers were female. 80.2% of all FTE teachers in primary schools were female and 56.8% in secondary schools. The comparable figures in 1997 were 65.0%, 76.9% and 53.1% respectively.
Overall, the average number of FTE primary school students per FTE teacher was 15.9. In government schools the average was 15.7, and in non-government schools it was 16.5. The equivalent figure for secondary schools was 12.1 students, with an average of 12.3 in government schools, and 11.7 in non-government schools.
 Print Page
 Print All