ANALYSIS AND COMMENTS
BALANCE ON GOODS AND SERVICES
The trend estimate of the balance on goods and services in April 2007 was a deficit of $1,104m, a decrease of $6m on the deficit in March.
In seasonally adjusted terms, the balance on goods and services in April 2007 was a deficit of $962m, a decrease of $666m on the deficit in March.
EXPORTS OF GOODS AND SERVICES
The trend estimate of goods and services credits fell $3m between March and April to $18,141m.
In seasonally adjusted terms, goods and services credits rose $263m (1%) to $18,079m. Non-rural goods rose $232m (2%) and other goods rose $69m (7%), while rural goods fell $58m (3%). Services credits rose $20m (1%).
Exports of goods
GOODS CREDITS

RURAL GOODS
The trend estimate of rural goods exports fell $19m (1%) to $2,028m.
In seasonally adjusted terms, exports of rural goods fell $58m (3%) to $2,017m.
The main components contributing to the fall in the seasonally adjusted series were:
- other rural, down $42m (5%)
- meat and meat preparations, down $24m (4%).
Partly offsetting these effects was cereal grains and cereal preparations, up $12m (4%).
In original terms, exports of rural goods fell $200m (9%) to $1,975m.
NON-RURAL GOODS
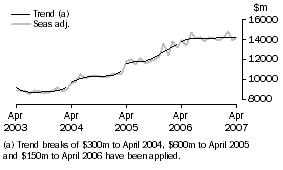
The trend estimate of non-rural goods exports fell $10m to $11,125m.
In seasonally adjusted terms, exports of non-rural goods rose $232m (2%) to $11,066m.
The main components contributing to the rise in the seasonally adjusted series were:
- metal ores and minerals, up $296m (11%)
- other non-rural, up $87m (7%)
- other mineral fuels, up $65m (5%)
- metals (excl. non-monetary gold), up $31m (2%).
Partly offsetting these effects were:
- other manufactures, down $215m (14%)
- coal, coke and briquettes, down $52m (3%).
In original terms, exports of non-rural goods rose $111m (1%) to $10,936m.
OTHER GOODS
The trend estimate of other goods exports rose $11m (1%) to $1,056m.
In seasonally adjusted terms, exports of other goods rose $69m (7%) to $1,061m.
The main component contributing to the rise in the seasonally adjusted series was non-monetary gold, up $121m (15%) partly offset by goods for processing, down $52m (85%).
In original terms, exports of other goods rose $63m (6%) to $1,051m.
Exports of services
SERVICES CREDITS

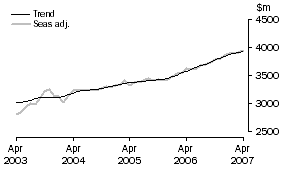
In trend terms, services credits rose $15m to $3,933m.
Seasonally adjusted, services credits rose $20m (1%) to $3,935m.
All components contributed to the rise in the seasonally adjusted estimates with:
- other services, up $8m (1%)
- travel services, up $8m
- transportation services, up $5m (1%).
Seasonally adjusted, tourism related services credits rose $12m to $2,524m. This series is seasonally adjusted independently to the series that comprise services credits.
IMPORTS OF GOODS AND SERVICES
The trend estimate of goods and services debits fell $8m between March and April to $19,246m.
In seasonally adjusted terms, goods and services debits fell $403m (2%) to $19,041m. Capital goods fell $247m (7%), intermediate and other merchandise goods fell $231m (3%), and consumption goods fell $25m (1%) while other goods rose $86m (17%). Services debits rose $15m.
Imports of goods
GOODS DEBITS

CONSUMPTION GOODS
The trend estimate of imports of consumption goods fell $11m to $4,718m.
In seasonally adjusted terms, imports of consumption goods fell $25m (1%) to $4,646m.
The main components contributing to the fall in the seasonally adjusted estimates were:
- food and beverages, mainly for consumption, down $54m (8%)
- household electrical items, down $33m (9%).
Partly offsetting these effects was non-industrial transport equipment, up $76m (6%).
In original terms, imports of consumption goods fell $81m (2%) to $4,328m.
CAPITAL GOODS
The trend estimate of imports of capital goods fell $31m (1%) to $3,481m.
In seasonally adjusted terms, imports of capital goods fell $247m (7%) to $3,322m.
The components contributing to the fall in the seasonally adjusted estimates were:
- industrial transport equipment n.e.s., down $157m (23%)
- ADP equipment, down $47m (8%)
- capital goods n.e.s., down $38m (8%)
- machinery and industrial equipment, down $34m (2%).
Partly offsetting these effects was civil aircraft, up $25m.
In original terms, imports of capital goods fell $232m (7%) to $3,216m.
INTERMEDIATE AND OTHER MERCHANDISE GOODS
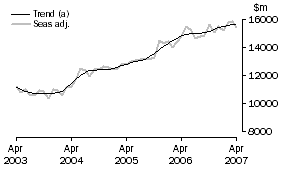
The trend estimate of imports of intermediate and other merchandise goods rose $54m (1%) to $6,822m.
In seasonally adjusted terms, imports of intermediate and other merchandise goods fell $231m (3%) to $6,826m.
The main components contributing to the fall in the seasonally adjusted estimates were:
- other merchandise goods, down $198m (71%)
- fuels and lubricants, down $133m (7%), with volumes of crude oil imports down 14% and prices up 5%
- iron and steel, down $27m (7%).
Partly offsetting these effects were:
- processed industrial supplies, up $126m (9%)
- other parts for capital goods, up $17m (2%).
In original terms, intermediate and other merchandise goods fell $545m (8%) to $6,621m.
OTHER GOODS
The trend estimate of imports of other goods fell $5m (1%) to $580m.
In both original and seasonally adjusted terms, other goods debits rose $86m (17%) to $601m.
The main component contributing to the rise in these estimates was non-monetary gold, up $203m (77%), partly offset by goods for processing, down $124m (99%).
Imports of services
SERVICES DEBITS

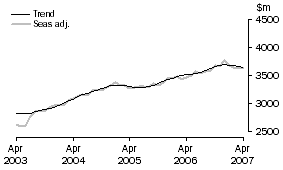
In trend terms, services debits fell $15m to $3,645m.
Seasonally adjusted, services debits rose $15m to $3,646m.
The components that contributed to the rise in the seasonally adjusted estimates were:
- travel services, up $16m (1%)
- other services, up $8m (1%).
Partly offsetting these effects was transportation services, down $9m (1%).
Seasonally adjusted, tourism related services debits rose $22 (1%) to $1,889m. This series is seasonally adjusted independently to the series that comprise services debits.
 Print Page
 Print All