JOBS
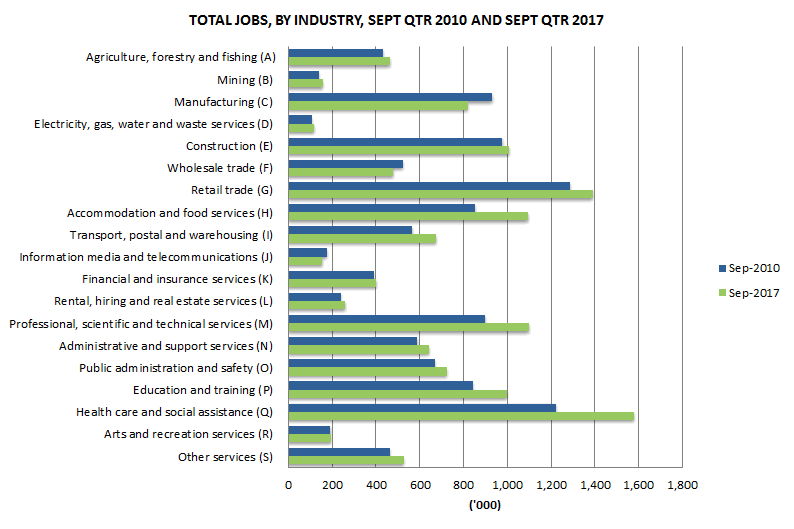
Filled jobs in Australia grew by 0.7% in the September quarter 2017, following a 1.4% rise in the June quarter 2017. Jobs grew 3.2% through the year in seasonally adjusted terms.
Labour Account Filled Jobs, Proportion by Industry, September quarter 2017

Industry | 
Labour Account
Filled Jobs
Sept qtr 2017
('000) | 
Proportion of Total
All Industries
Sept qtr 2017
(%) |

| 
| 
|

Agriculture, forestry and fishing (A) | 
501.4 | 
3.7 |

Mining (B) | 
161.6 | 
1.2 |

Manufacturing (C) | 
873.5 | 
6.4 |

Electricity, gas water and waste services (D) | 
122.7 | 
0.9 |

Construction (E) | 
1,045.8 | 
7.6 |

Wholesale trade (F) | 
524.6 | 
3.8 |

Retail trade (G) | 
1,459.6 | 
10.6 |

Accommodation and food services (H) | 
1,181.2 | 
8.6 |

Transport, postal and warehousing (I) | 
703.4 | 
5.1 |

Information media and telecommunications (J) | 
171.3 | 
1.2 |

Financial and insurance services (K) | 
428.0 | 
3.1 |

Rental, hiring and real estate services (L) | 
287.8 | 
2.1 |

Professional, scientific and technical services (M) | 
1,172.4 | 
8.6 |

Administrative and support services (N) | 
818.8 | 
6.0 |

Public administration and safety (O) | 
755.1 | 
5.5 |

Education and training (P) | 
1,059.3 | 
7.7 |

Health care and social assistance (Q) | 
1,668.5 | 
12.2 |

Arts and recreation services (R) | 
214.8 | 
1.6 |

Other services (S) | 
556.7 | 
4.1 |

Total All Industries | 
13,706.6 | 
100.0 |
Labour Account Filled Jobs, Percentage Change by Industry, September quarter 2017
| Industry | Trend | Seasonally Adjusted |
 | Jun qtr 2017 to
Sept qtr 2017
% change | Sept qtr 2016 to
Sept qtr 2017
% change | Jun qtr 2017 to
Sept qtr 2017
% change | Sept qtr 2016 to
Sept qtr 2017
% change |
 |  |  |  |  |
| Agriculture, forestry and fishing (A) | 1.9 | 3.7 | 3.0 | 4.3 |
| Mining (B) | 0.9 | 0.8 | 1.9 | 2.0 |
| Manufacturing (C) | 0.6 | 1.4 | 1.0 | 0.3 |
| Electricity, gas water and waste services (D) | 1.0 | 11.8 | -2.6 | 11.6 |
| Construction (E) | 0.2 | -1.1 | -2.9 | -1.8 |
| Wholesale trade (F) | -1.2% | -3.0 | -2.3 | -6.5 |
| Retail trade (G) | 0.7 | 2.0 | 1.0 | 1.9 |
| Accommodation and food services (H) | 2.0 | 6.3 | 2.1 | 7.8 |
| Transport, postal and warehousing (I) | 3.7 | 6.2 | 5.7 | 8.6 |
| Information media and telecommunications (J) | -1.0 | -5.3 | -1.0 | -5.3 |
| Financial and insurance services (K) | 1.2 | 3.2 | 1.4 | 3.9 |
| Rental, hiring and real estate services (L) | 0.8 | 0.4 | 2.8 | 2.7 |
| Professional, scientific and technical services (M) | 2.5 | 12.4 | 3.2 | 13.1 |
| Administrative and support services (N) | -0.2 | 2.7 | -2.8 | 2.8 |
| Public administration and safety (O) | 0.5 | 1.9 | 1.1 | 2.4 |
| Education and training (P) | 1.2 | 2.5 | 2.0 | 2.8 |
| Health care and social assistance (Q) | -0.5 | 2.4 | -0.8 | 3.1 |
| Arts and recreation services (R) | -3.3 | -5.6 | -3.4 | -5.5 |
| Other services (S) | 1.6 | 4.9 | 0.9 | 3.3 |
| Total All Industries | 0.8 | 3.0 | 0.7 | 3.2 |
 SECONDARY JOBS
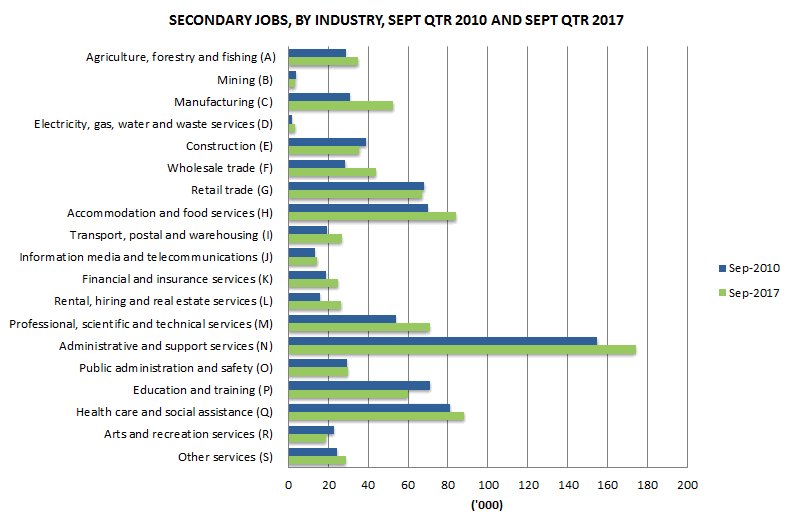
Secondary jobs can be held by persons who have their main job in the same or a different industry. In the September quarter 2017 there were 891,699 secondary jobs representing 6.4% of total jobs.
The top three industries who have the highest number of secondary jobs were Administrative and support services, Health care and social assistance and Accommodation and food services.

 Quality Declaration
  Print Page
 Print All