CHAPTER 6 ENSURING SEIFA MEASURES DISADVANTAGE
INTRODUCTION
This chapter briefly discusses some of the methods used to validate SEIFA in order to ensure SEIFA measures relative socio-economic advantage and disadvantage.
CHECKING SEIFA
How well do the SEIFA indexes reflect relative disadvantage or advantage in towns and neighbourhoods across Australia? The SEIFA indexes are checked in a number of ways before release to ensure that the indexes reflect relative socio-economic disadvantage or advantage.
Checking the indexes
The first part of the checking process is to examine the construction of each SEIFA index and the indexes themselves. Each index includes a wide range of variables that are deemed to be related to the concept of relative socio-economic disadvantage of that index. A variable is considered for inclusion if it is conceptually sound, however, a variable is only included after further checks have been carried out. This involves checking if the variable weights make intuitive sense, and analysing the relationship between the variable with all other variables. If the variable adds little value to the index, or if the variable appears not to measure relative socio-economic disadvantage, then it is not included in the index construction. As discussed in Chapter 3, a variable is also not included if it is deemed to be too similar to other variables, as this could bias the index.(footnote 1) A group of academics and expert users also provided suggestions on conceptual and index construction issues, as well as recommendations for future SEIFA indexes.
The final indexes were checked using other data sources, including survey information on health, income, net worth as well as measures of remoteness. One example is briefly discussed in the 'SEIFA and remoteness: An example' section below. We also consider how similar the 2006 indexes are to previous SEIFA indexes.
Checking the scores
The next step is to check the actual index scores. Because it is not feasible to investigate each score individually (there are 37,457 scores for each of the four CD indexes, plus the index scores for the larger geographic areas), we instead look closely at areas which:
- have the highest and lowest SEIFA scores in each state or territory;
- have a substantially different rank to 2001; or
- have substantially different ranks across the four indexes.
Where particular CDs were identified through this process, we examined the Census variables to see why these CDs might stand out. We also used local knowledge to check the highest and lowest SEIFA scores.
SEIFA and remoteness: An example
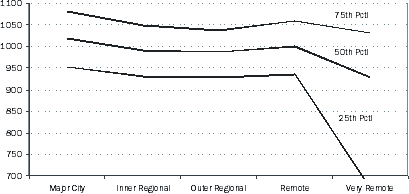
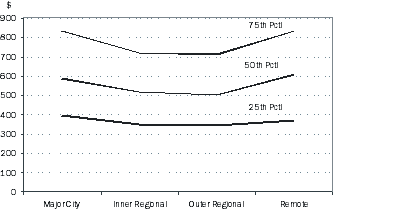
The SEIFA indexes are checked using different data sources, such as measures of remoteness. We expect relative socio-economic disadvantage to be related to remoteness for various reasons, including a reduced ability to participate in society in very remote areas. We can also use survey data to analyse the relationship between remoteness and relevant information, and then use this analysis to check the relationship between remoteness and the SEIFA indexes. For this example, we compare the remoteness distribution of the Index of Economic Resources with the remoteness distribution of household income.(footnote 2) While the Index of Economic Resources captures more than just income information, we would expect similarities in their remoteness distributions.
Figure 6.1 shows the relationship between the Index of Economic Resources (IER) scores and the remoteness measure Accessibility/Remoteness Index of Australia (ARIA).(footnote 3) The 25th, 50th and 75th percentile scores are shown.(footnote 4) The figure shows that Major City IER scores tend to be higher than the other regions; and that Remote CD scores also tend to be slightly higher than Outer Regional area scores. Also, the Very Remote CD scores are typically much lower than CD scores in the other regions.
For comparison, figure 6.2 shows the relationship between remoteness with household income, using the Survey of Income and Housing (2005-6, unpublished data).(footnote 5) Note that there are very few Very Remote households actually surveyed, so these households are not shown on the figure. This figure shows a similar remoteness distribution for income. Again, household income tends to be slightly higher in Major City households than other areas; and are again higher in Remote households than Outer Regional households. Although not shown, similar analysis was undertaken for various income measures and household net worth.
Figure 6.1 IER Scores by ARIA
 Figure 6.2 Equivalised Disposable Income by ARIA

1 A list of variables is included in the Appendix.
<back
2 Net worth distribution was also checked. Refer to the Glossary for Net Worth definition.
<back
3 Maximum and minimum CD scores not shown for clarity.
<back
4 These percentiles indicate the upper limit of scores of the lowest 25%, 50% and 75% of CDs respectively.
<back
5 Maximum and minimum household scores not shown for clarity.
<back
 Print Page
 Print All