Insights
Seasonally adjusted figures
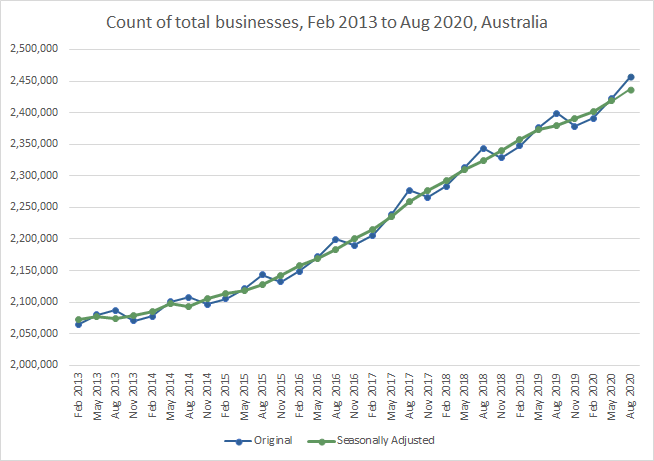
There is a strong seasonal pattern in the counts of Total Businesses, Business Entries and Business Exits. To assist in distinguishing between short-term trends and the seasonal patterns, seasonally adjusted counts have been prepared for these headline figures. It is important to note that trend estimates have been suspended in a range of ABS releases during COVID-19 while the impacts on data are better understood. For more information, please refer to methodology point 2.6.
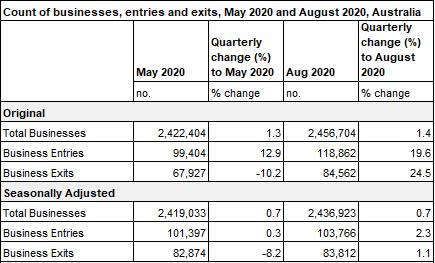
In the May 2020 quarter, in seasonally adjusted terms, the number of businesses in the Australian economy increased by 0.7%. Business Entries in this quarter grew by 0.3%, and Business Exits decreased by 8.2% - a significant decrease compared to previous quarters.
In the August 2020 quarter, in seasonally adjusted terms, the number of businesses in the Australian economy again increased by 0.7% and both Business Entries and Business Exits increased - by 2.3% and 1.1% respectively.
Trends in business entries
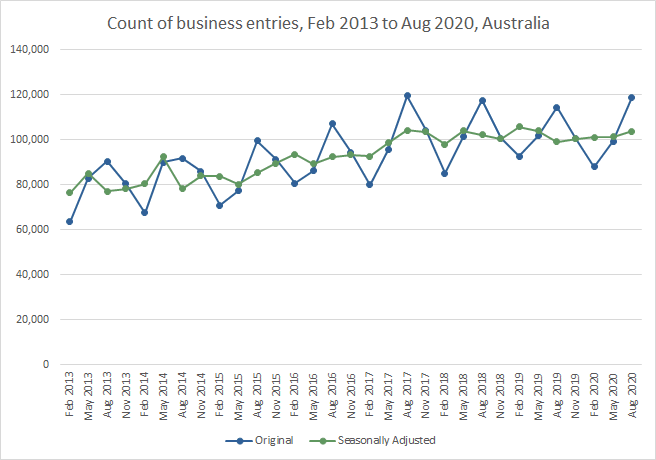
Business Entries include Business Births and Other Entries. Business Births represent new business registrations, and on average, account for approximately 60% of Business Entries each quarter. Other Entries include; businesses that were previously cancelled and have re-activated their ABN (resurrections); businesses that were previously long-term non-remitters (LTNRs) that have become active again by remitting Goods and Services Tax (GST) through their Business Activity Statement (BAS); and businesses that were previously out-of-scope, such as those with a non-market sector industry classification, that have now become in-scope due to an Industry reclassification. Business Entries as a result of resurrections and long-term non-remitters becoming active again, are a normal occurrence in the economy. These businesses may have been actively trading during the period of cancellation/non-lodgement of BAS, or the business may have been dormant prior to being restarted (See Limitations of Data, note 3). Business Entries are typically highest in the quarter ending August.
In the May and August 2020 quarters, the total number of Business Entries were consistent with trends over the past three years.
Composition of business entries
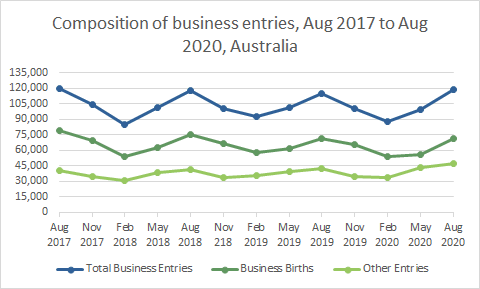
Possible impacts of COVID-19 on businesses can be further examined by looking at the compositional shifts in Business Entries. In the May 2020 quarter, Business Births were the lowest recorded in a May quarter over the last three years, and down 9.0% on the same quarter last year. There is generally a minimal reporting lag in new business registrations, so the decrease in the number of Business Births may be a result of COVID-19 and the associated government restrictions. In the August quarter, when restrictions were easing in a number of states and territories, Business Births returned to levels consistent with the same period last year.
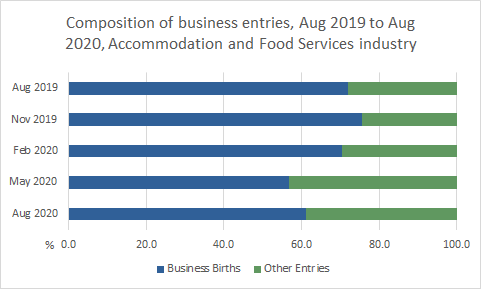
At the same time, Other Entries increased by 28.3% in the May 2020 quarter, and 9.5% in the August 2020 quarter. Other Entries in these quarters were the highest of any period over the past 3 years. The net effect of these shifts meant that total Business Entries in the May and August 2020 quarters were consistent with previous years, despite being compositionally different.
The increase in Other Entries is primarily a result of businesses reactivating cancelled ABNs, or those that were defined as long term non-remitters (LTNRs) recommencing BAS lodgement after a period of inactivity. Both of these categories of Other Entries recorded higher counts in the May and August 2020 quarters compared to previous periods in the last three years. This could be due to businesses reactivating due to increased demand and innovation, or the Commonwealth and State government support packages available (in particular where these required up-to-date ABN details, lodgements of BAS and/or Tax Returns as part of the eligibility criteria).
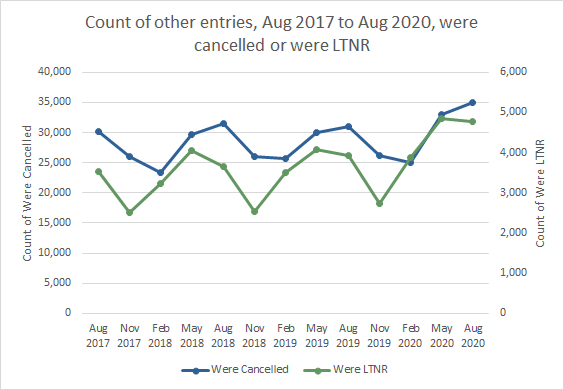
In May (8,181) and August (9,568) quarters 2020, the largest number of Other Entries were in the Construction industry. Businesses operating in the industries most impacted by COVID-19 restrictions made up a larger proportion of Other Entries when compared with the same period in previous years, including Wholesale and Retail Trade, and Accommodation and Food Services.
Trends in business exits
Business Exits include Business Cancellations and Other Exits. Business Cancellations represent businesses that have formally de-registered. This process typically happens when; a business has closed down, a business has been sold, a business has significantly changed structure, or a business is no longer operating in Australia. Other Exits include; businesses defined as long term non-remitters (LTNRs) as they have not lodged BAS data for 5 quarters (or 3 years for annual remitters); and businesses that were previously in-scope of CABEE that have become out-of-scope, such as those moving to a non-market sector or industry classification.
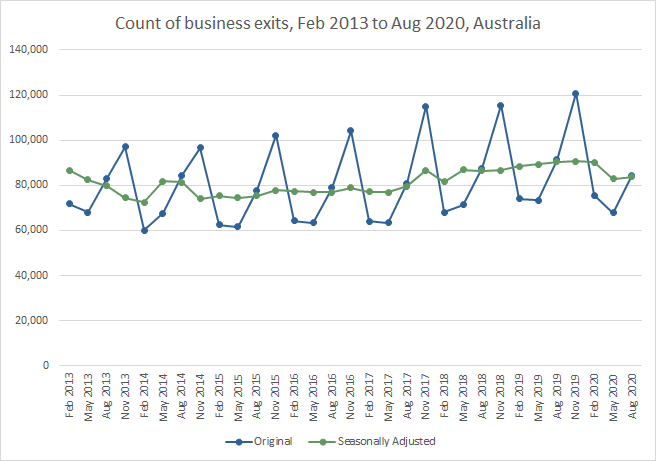
Business Exits typically occur sometime after the business has ceased operating. For example, before a business is able to cancel its ABN it is required to submit any outstanding activity and tax statements, and settle any remaining tax debts, so Business Cancellations will typically not occur until after the end of the financial year. This contributes to Business Exits typically being highest in the November quarter, along with regular administrative and quality assurance processes. As such, an increase in Business Exits as a result of COVID-19 would not yet be reflected in the data in this paper, and may occur in subsequent quarters.
In the May and August 2020 quarters, Business Exits were lower than the same periods in the past three years.
Composition of business exits
In the May 2020 quarter, Business Cancellations were the lowest recorded over the past three-year period. During the same period, Other Exits have remained consistent with the trends in previous years.
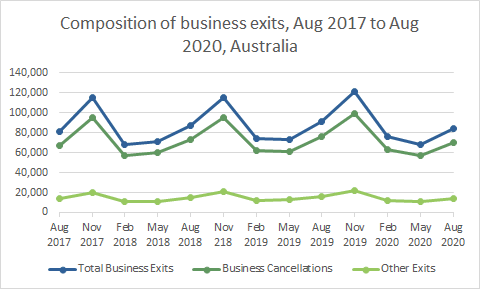
Similar to the trend in Other Entries, Business Cancellations in the industries most affected by COVID-19 and the associated restrictions, including Retail Trade and Accommodation and Food Services, accounted for a lower share of total exits than in previous periods.
Lower levels of Business Cancellations may be influenced by a range of factors, for example: the time it takes for a business to formally close; delays in the reporting process; the government support packages currently available to businesses aimed at mitigating the impact of COVID-19 and supporting economic recovery (including the temporary changes to the insolvency safe harbour rules); businesses pausing temporarily to determine ongoing viability; or an increase in demand and innovation in some industries.
Trends in employing businesses
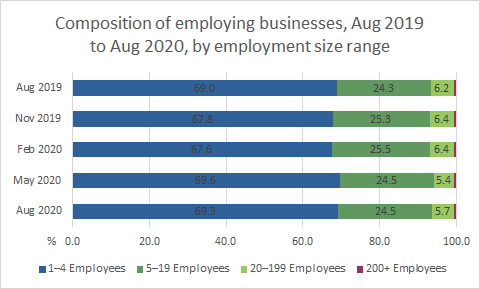
Businesses can be classified as employing or non-employing. In the August 2020 quarter 37% of businesses (912,917) in the Australian economy were employers. This proportion has remained relatively stable over the timeseries in this paper.
In the May 2020 quarter there was a substantial decrease in the number of businesses in the 5-19, 20-199 and 200+ employment size ranges when parts of Australia were still under heavy restrictions due to COVID-19. These decreases were primarily influenced by surviving businesses decreasing staff levels and moving to smaller employment size ranges. This includes businesses where employees were stood down without pay, made redundant, or placed on unpaid leave during the period. Employees receiving JobKeeper payments, paid leave or other entitlements during the reference period are considered to be employees in these counts.
In the August 2020 quarter, when restrictions were easing in a number of states and territories, the number of employing businesses - across all employment size ranges - increased. This increase was primarily a result of surviving businesses increasing staff levels and moving to larger employment size ranges. While this increase was moderate, the number of businesses in the 20-199 and 200+ employee size ranges were 5.4% and 4.0% lower than pre-COVID-19 levels respectively.
This data is consistent with other ABS economic series, including Labour Force estimates and payroll jobs derived from Single Touch Payroll. The data shows large reductions in employment and jobs between February and May 2020, followed by moderate increases to August 2020.
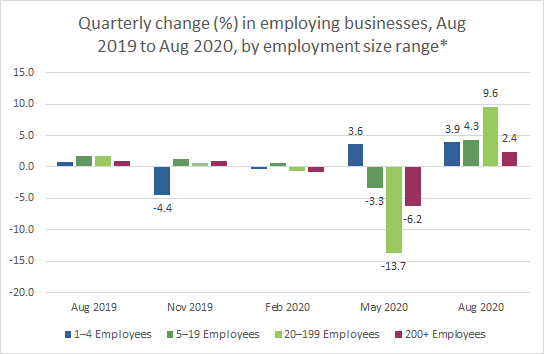
*The decrease in businesses with 1-4 employees during the November 2019 quarter was primarily attributable to regular processing and quality assurance processes during this period. See limitations of data point 1 for more information.
Composition of employing businesses
In total, 80,159 surviving businesses changed employment size range during the May 2020 quarter. Of these businesses, approximately two-thirds (66.9%) moved to a smaller employment size range. The vast majority (94.9%) of these businesses changed by only one employment size range during the quarter.

*The movement of surviving businesses between employment size ranges includes both real world changes to a business (such as employment changes due to economic events in the quarter, or seasonal employment patterns), and quality assurance activities. See methodology points 1.2 and 2.3 for more information.
The movement of surviving businesses between employment size ranges has resulted in a change in the composition of employing businesses, and an increase in the number of non-employing businesses. In the May 2020 quarter, businesses with 1-4 employees represented 69.6% of total employing businesses, the highest of the past five quarters. In the same period, businesses with 20-199 employees represented 5.4% of employing businesses, the lowest of the past five quarters and a decrease of 1 percentage point on the previous quarter.
Businesses are grouped by employment size ranges as a means of comparing similar businesses. In the annual CABEE publication these size ranges are based on an annualised employment figure. In this release, these size ranges are based on a businesses’ employment count when the data is extracted. It is worth noting that a business that temporarily reduced its number of employees during COVID-19, and consequently moved to a smaller employment size range, may not necessarily behave like other businesses in the smaller size range in the short term.
Trends in industry
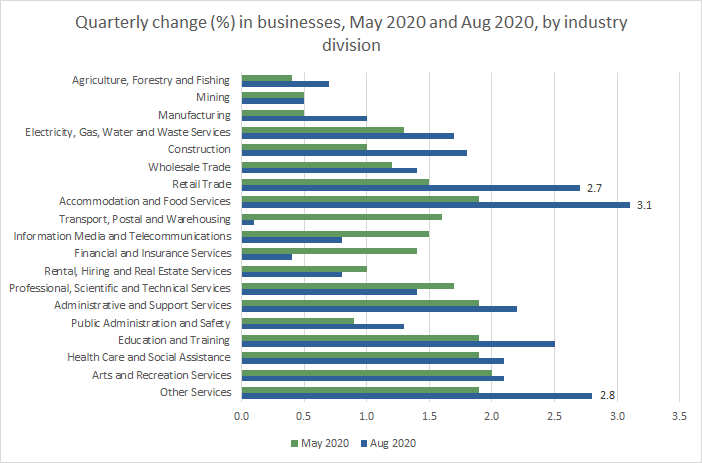
Growth in the counts of businesses in the May 2020 quarter was slightly higher than in previous periods for many industry divisions. At the national level, this growth was bolstered by an increase in Other Entries and a decrease in Business Cancellations during this period. The industry divisions that experienced the largest net growth in the August 2020 quarter were Retail Trade, Accommodation and Food Services, and Other Services; all of which are known to have been heavily impacted by COVID-19. The industry division that experienced the lowest level of net growth in the August 2020 quarter is Transport, Postal and Warehousing. More detail on these movements is provided in the following section.
Accommodation and Food Services
Accommodation and Food Services is one of the industry divisions most affected by COVID-19 and the associated restrictions. In April 2020 this division had the highest proportion of businesses receiving the JobKeeper wage subsidy, with close to 60% of businesses in that industry receiving the payment for one or more employees (The JobKeeper Payment: Three-month review, Treasury). It also had the steepest decline in payroll jobs during the COVID-19 period to date, with a decrease of 21.1% between 14 March and 22 August 2020 (Weekly Payroll Jobs and Wages in Australia, ABS).
The number of businesses in the Accommodation and Food Services industry division increased by 3.1% in the August 2020 quarter, following an increase of 1.9% in the May 2020 quarter. The largest contributor to growth in Accommodation and Food Services was Cafes and Restaurants (ANZSIC class 4511), which increased by 4.7% (2117 businesses) in the August 2020 quarter. This growth was driven by a large net movement of surviving businesses into the class. Given the timing of these industry re-classifications aligns with the timing of business applications for Commonwealth and State government support packages, it is likely that these businesses updated their details with the ATO at the same time. In general, these changes are considered to be quality improvements to the classification of business activity using ANZSIC, rather than a short-term activity change.
An increase in Other Entries to the Accommodation and Food Services industry also resulted in a compositional shift in Business Entries in the May and August 2020 quarters.
Retail Trade
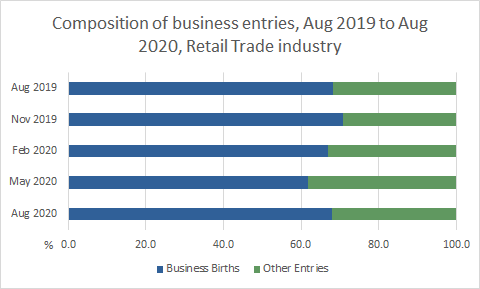
Retail Trade is another industry division that has been greatly impacted by COVID-19 and the associated restrictions. In the August 2020 quarter the number of businesses in the Retail Trade industry division increased by 2.7%, following an increase of 1.5% in the May 2020 quarter. The largest contributor to the growth in the August 2020 quarter was Non-Store Retailing (ANZSIC class 4310), which increased by 7.1% (1,170 businesses). Non-store retailing includes direct shopping businesses and retailers who only engage in e-commerce. The strong growth in Non-Store Retail is a consistent trend both before and during the pandemic. In the last three financial years the counts of businesses in the Retail Trade division would have decreased in the absence of Non-Store Retailing. Similar to previous quarters, in the August 2020 quarter Non-Store Retailing had almost four-fifths (78.9%) of Business Entries come from new Business Births, accounting for 29.3% of total Business Births in the division.
Due to the continued growth in new Business Births in the Non-Store Retailing class, the increase in Other Entries in other Retail Trade industry classes did not result in a large shift in the composition of total Business Entries in the division. While the composition changed in the May 2020 quarter, it returned to levels consistent with previous years in the August 2020 quarter.
Other Services
The number of businesses in the Other Services industry division grew by 2.8% during the August 2020 quarter, following an increase of 1.9% in the May 2020 quarter. Hairdressing and Beauty Services (ANZSIC class 9511) had the largest growth in the August 2020 quarter, increasing by 1,259 businesses, or 4.8%, and accounted for 40% of the growth in this division. Approximately 60% of the growth in this class was attributed to Business Births.
Transport, Postal and Warehousing
The two largest industry class declines in the August 2020 quarter were Taxi and Other Road Transport (ANZSIC class 4623), which declined by 1,416 businesses or 3.6%, and Other Transport Support Services not elsewhere classified (ANZSIC class 5299), which declined by 500 businesses or 0.8%. This is in contrast to previous years where both of these industry classes grew strongly due to the growth in ride sharing services, resulting in Transport, Postal and Warehousing becoming the fastest growing industry division for the past five years. These declines were offset by an increase in the number of businesses in Courier Pick-up and Delivery Services (ANZSIC class 5102), which increased by 1,215 businesses or 5.0%, and Road Freight Transport (ANZSIC class 4610), which increased by 617 businesses or 1.1%, during the August 2020 quarter.
Trends in states and territories
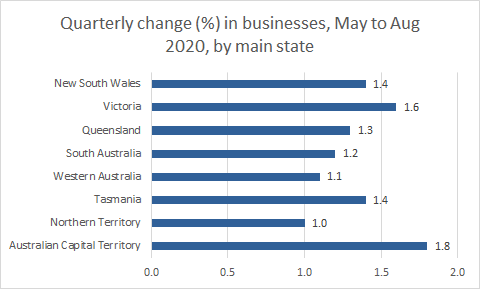
In the August 2020 quarter, the number of businesses in the Australian Capital Territory increased by 1.8%, the highest growth rate of any state or territory. This growth was driven by a high Business Entry rate of 5.7%. Despite Victoria being disproportionately affected by COVID-19 and the associated restrictions since July 2020, it experienced the second highest growth rate of 1.6%, or 10,780 businesses.
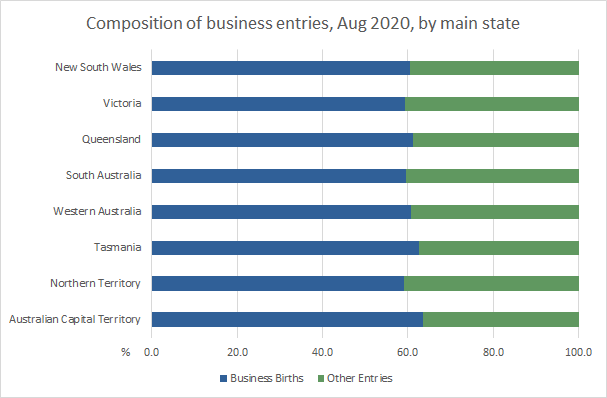
Decomposing the Business Entries into Business Births and Other Entries, in the August 2020 quarter the Northern Territory, Victoria and South Australia had the lowest proportion of Business Entries attributed to Business Births.
Trends in Type of Legal Organisations (TOLO)
In the August 2020 quarter, company entries (48,414 businesses) exceeded sole proprietor entries (44,811 businesses). Over the past three financial years, sole proprietor entries have exceeded that of companies, largely driven by ABN registrations in the Transport, Postal and Warehousing industry division.
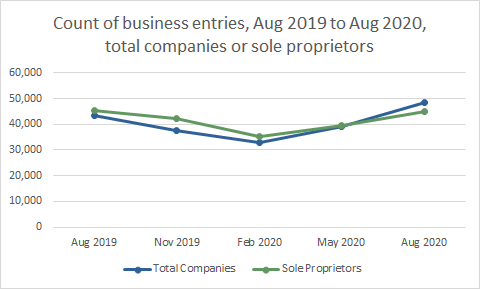
The number of Business Entries for sole proprietors in the August 2020 quarter were consistent with previous periods, sole proprietors accounted for almost half (47%) of Other Entries (including resurrections) despite only representing 28% of total businesses in the economy.
 Print Page
 Print All