MAIN FEATURES
POPULATION AND GROWTH
The preliminary estimated resident population (ERP) of Australia at 30 September 2008 was 21,542,000 persons, an increase of 389,000 since 30 September 2007 and 111,000 persons since 30 June 2008. The increase for the year ended 30 September 2008 is the largest recorded for a 12 month period since the ERP concept was introduced in 1971 (see paragraphs 4 to 6 of the Explanatory Notes for more detail).
The annual population growth rate for the year ended 30 September 2008, at 1.84% was the fastest annual growth rate for a year ended 30 September since the ERP concept was introduced in 1971.
COMPONENTS OF POPULATION CHANGE
The growth of Australia's population has two components: natural increase (the number of births minus the number of deaths) and net overseas migration.
Natural Increase
Natural increase for the 12 months ended 30 September 2008 was 153,400 persons, an increase of 8.7% (or 12,300 persons) on the natural increase for the year ended 30 September 2007 (141,100 persons).
BIRTHS
The preliminary estimate for births during the year ended 30 September 2008 (295,200) was 5.1% higher than the figure for the year ended 30 September 2007 (281,000).
DEATHS
The preliminary estimate for deaths during the year ended 30 September 2008 (141,700) was the highest ever recorded for a year ending 30 September.
Net Overseas Migration
For the year ended 30 September 2008, Australia's preliminary net overseas migration (NOM) estimate was 235,900 persons. This was the difference between 464,800 overseas arrivals that were added to the population (NOM arrivals) and 229,000 overseas departures that were subtracted from the population (NOM departures). The contribution made to population growth by NOM (60.6%) was higher than that of natural increase (39.4%).
Net overseas migration estimates for September quarter 2006 to June quarter 2007 have been revised in this issue based on actual duration of stay in Australia and overseas of international travellers. For 2006-07, the estimate of NOM arrivals was revised up by 50,100 to 437,500 and the estimate of NOM departures was revised down by 5,100 to 204,700. Accordingly NOM was revised from 177,600 to 232,800 for 2006-07.
STATES AND TERRITORIES: POPULATION AND GROWTH
The estimated resident populations for the states and territories at 30 September 2008 were as follows: New South Wales 7,017,000, Victoria 5,340,000, Queensland 4,320,000, South Australia 1,608,000, Western Australia 2,188,000, Tasmania 498,900, the Northern Territory 221,100 and the Australian Capital Territory 346,400.
All states and territories recorded positive population growth over the 12 months ended 30 September 2008. Western Australia recorded the fastest growth rate (2.9%), followed by Queensland (2.5%), the Northern Territory (2.2%), Victoria (1.8%), the Australian Capital Territory (1.4%), New South Wales (1.3%), South Australia (1.1%) and Tasmania (0.9%).
COMPONENTS OF POPULATION CHANGE
At the state and territory level, population growth has three components: natural increase, net overseas migration and net interstate migration.
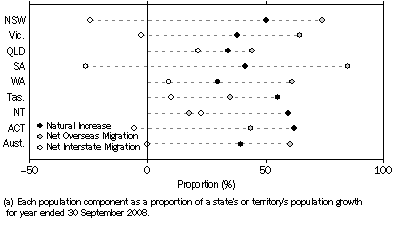
Although all states and territories experienced positive population growth in the year ended 30 September 2008, the proportion that each of these components contributed to population growth varied between the states and territories.
Population Components as proportion of total growth(a) - Year ended 30 September 2008

Natural Increase
As illustrated in the graph above, natural increase was the major component of population growth in the Australian Capital Territory at 62.1% (3,100 persons), the Northern Territory at 59.6% (2,800 persons) and Tasmania at 55.1% (2,500 persons) for the year ended 30 September 2008.
BIRTHS
The number of births registered for the 12 months ended 30 September 2008 increased in comparison with the previous year, in all states and territories except Tasmania and the Northern Territory. Queensland recorded the largest percentage increase of 11.9%, followed by Western Australia (5.9%).
DEATHS
The number of deaths registered for the 12 months ended 30 September 2008 increased in comparison with the previous year, in all states and territories except Tasmania. The Northern Territory recorded the largest percentage increase of 7.7%.
Net Overseas Migration
The contribution of NOM, as illustrated in the previous graph, was the major component of population growth in South Australia at 84.9% (15,300 persons) for the year ended 30 September 2008, followed by New South Wales at 74.1% (68,400 persons). This was followed by Victoria at 64.6% (62,700 persons), Western Australia at 61.4% (38,400 persons) and Queensland at 44.2% (46,500). All other states and territories experienced positive net overseas migration.
Net Interstate Migration
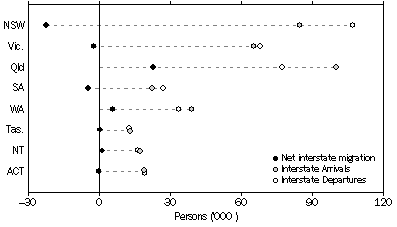
For the year ended 30 September 2008, Queensland experienced the highest positive net interstate migration with a gain of 22,700 persons. Other states and territories that experienced positive net interstate migration were Western Australia (5,600 persons), the Northern Territory (1,100 persons) and Tasmania (450 persons). Negative net interstate migration was experienced by New South Wales (-22,400 persons), South Australia (-4,700 persons), Victoria (-2,400 persons) and the Australian Capital Territory (-290 persons).
Interstate migration, Arrivals, Departures and Net
- States and territories
- Year ended 30 September 2008

HOUSEHOLD ESTIMATES
The table below presents the first household estimates based on the 2006 Census of Population and Housing (Census) and the final estimated resident population at 30 June 2006.
The table also presents household projections based on 2001 Census estimates. As indicated the June 2006 estimate of households based on the 2006 Census and the final estimated resident population at June 2006, are 3.5% below the previous projections based on the 2001 Census.
Estimates and projections of the number of households for years other than 2006 have not yet been compiled. As a result the household estimates presented in Tables 20 and 21 continue to be projections based on the 2001 Census. They are not comparable to the 2006 estimates presented below. New estimates and projections based on the 2006 Census will be available in 2010.
Estimated and Projected Number of households - at 30 June 2006 |
|  |
 | 2006 base(a) | 2001 based projection(b) | Difference | Difference |  |
| State/Territory | households | households | no. | % |  |
|  |
| New South Wales | 2 548 057 | 2 643 044 | -94 987 | -3.6 |  |
| Victoria | 1 928 617 | 1 975 635 | -47 018 | -2.4 |  |
| Queensland | 1 513 021 | 1 583 073 | -70 052 | -4.4 |  |
| South Australia | 626 547 | 648 999 | -22 452 | -3.5 |  |
| Western Australia | 776 266 | 806 287 | -30 021 | -3.7 |  |
| Tasmania | 196 052 | 202 760 | -6 708 | -3.3 |  |
| Northern Territory | 64 374 | 67 226 | -2 852 | -4.2 |  |
| Australian Capital Territory | 126 500 | 130 314 | -3 814 | -2.9 |  |
| Australia(c) | 7 780 193 | 8 058 448 | -278 255 | -3.5 |  |
|  |
| (a) Data are based on the 2006 Census. |
| (b) Data are based on the 2001 Census. For further information see Series II, Household and Family Projections, Australia, 2001 to 2026 (cat. no. 3236.0) and paragraphs 35-37 of the Explanatory Notes. |
| (c) Includes Other Territories - see paragraph 2 of the Explanatory Notes |
 Print Page
 Print All
 Quality Declaration