 PRICES
CONSUMER PRICE INDEX
Growth in Perth's consumer price index (CPI) continued to slow over the last three quarters, from a peak of 1.8% in the June quarter 2006 to 0.2% in the March quarter 2007. Current quarter growth was the lowest since the June quarter 2003 (0.0%), but remained above national CPI growth of 0.1%. The slowing in Perth's CPI growth was mainly due to declining prices for fruit (down 28.1%), furniture (down 5.3%) and holiday travel and accommodation (domestic down 3.6% and overseas down 4.6%). Fruit prices were lower in all capital cities mainly due to falling banana prices, as production returned to normal levels following extensive crop damage in Queensland from Cyclone Larry in the March quarter 2006. Price falls for holiday travel and accommodation came after a seasonal spike in accommodation tariffs and airfares in the December quarter 2006.
Perth's CPI growth in the March quarter 2007 was mostly driven by price increases in housing (up 1.1%), education (up 8.0%) and health (up 3.5%). Housing continued to underpin prices growth in Perth, as house purchase costs (up 1.1%) and rents (up 2.6%) continued to climb, while the price of education and health are invariably higher in the first quarter of each calendar year. Education costs rise due to one-off price increases associated with the commencement of the new school year and health costs increase from the reduction in consumers who qualify for subsidised medications under the Pharmaceuticals Benefit Scheme.
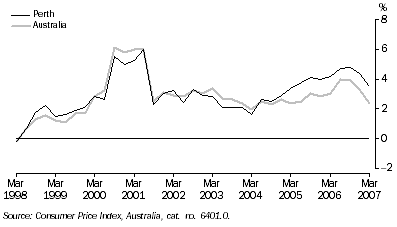
CONSUMER PRICE INDEX (ALL GROUPS), Change from same quarter previous year

Perth's CPI rose 3.5% through the year to March quarter 2007, a rate that has continued to decline from a peak of 4.8% through the year to September quarter 2006. Perth's 3.5% CPI growth was the 2nd largest among the states and territories, behind Darwin with an increase of 4.0% through the year. National CPI growth followed a similar downward trend to Perth, declining from 4.0% through the year to June quarter 2006 to 2.4% through the year to March quarter 2007 - the lowest annual rise since the March quarter 2005 (2.4%). The underlying inflation rate, as calculated by the Reserve Bank of Australia (RBA), moderated to 2.7% through the year to March quarter 2007, well within the RBAs target range for inflation of 2 to 3 percent. Notably, the CPI headline inflation rate of 2.4%, eased more markedly than the RBA underlying rate, mainly due to price falls in the volatile items of fuel and food in recent quarters.
WAGE PRICE INDEX
Growth in Western Australia's wage price index (WPI) of total hourly rates of pay excluding bonuses remained steady at 1.1% in the March quarter 2007, following increases of 1.3% and 1.1% in the September and December quarters of 2006 respectively. In the March quarter 2007, wages rose 1.2% in the private sector, more than twice the rate of public sector wages (up 0.5%). Nationally, the WPI also grew 1.1% in the current quarter, following an increase of 1.0% in the December quarter 2006.
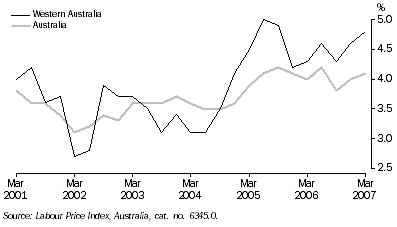
WAGE PRICE INDEX, Change from same quarter previous year

Western Australia's WPI rose 4.8% through the year to March quarter 2007, higher than the 4.6% rise in the previous period and higher than national wages growth of 4.1%. Strong wages growth was recorded in the Western Australian industries of construction (up 6.8%), personal and other services (up 6.8%) and mining (up 6.7%). From an occupation perspective, wages growth was strong for labourers and related workers, and tradespersons and related workers, both up 5.9%.
 Print Page
 Print All