This article was published in the July 2008 issue of Australian Labour Market Statistics (cat. no. 6105.0).
QUARTERLY LABOUR FORCE UNDERUTILISATION RATE
INTRODUCTION
Labour underutilisation is the extent to which available labour is underutilised - either through unemployment or underemployment (end note 1). The extent to which available labour is underutilised is of interest from a number of perspectives. From an economic perspective, there is interest in the amount of spare capacity in the labour supply and its potential to contribute to the production of goods and services. From a social viewpoint, there is concern that people whose aspirations for work are not being met may suffer financially, personally and socially.
In Australia, the labour force underutilisation rate is defined as the sum of the number of people unemployed and the number underemployed, expressed as a proportion of the labour force. It can also be viewed as the sum of the unemployment rate and the underemployment rate.
Until recently the annual Underemployed Workers Survey (UEW) conducted in September has been the prime source of information on underemployed workers for compiling the labour force underutilisation rate. However, since February 2003 the ABS has also been collecting quarterly data on underemployed workers in the Labour Force Survey (LFS). This quarterly time series has a more conceptually correct basis, and has provided the opportunity to produce more frequent and timely measures of changes in underemployment and, in turn, the underutilisation rate.
This article presents for the first time quarterly estimates of labour force underutilisation. This quarterly labour force underutilisation rate (QLFUR) replaces the existing annual rate which was first published in Information paper - Measures of labour underutilisation (cat. no. 6296.0) in 2002 and subsequently published annually in Australian Labour Market Statistics (cat. no. 6105.0), for September 1994 to September 2007.
BACKGROUND
Quarterly estimates of underemployment consistent with ILO definitions are available from the LFS from May 2001 onwards. Prior to this, it was not possible for the ABS to produce estimates of underemployed part-time workers entirely consistent with ILO definitions.
Information on the number of part-time workers who prefer to work more hours was collected monthly in the LFS, from February 1978 to March 2001. While this provides a proxy measure of the number of underemployed part-time workers, information on the 'availability' to work more hours was not collected. Thus estimates of underemployment, consistent with the ILO definition, could not be made.
Data on part-time workers who prefer to work more hours have been collected quarterly (February, May, August, November) in the LFS since May 2001. At this time an additional question was added to the LFS questionnaire to determine whether part-time workers preferring to work more hours were available to work more hours in the reference week (end note 2). While this additional information provided a closer approximation of the number of underemployed part-time workers, it still did not allow for estimates fully consistent with the ILO definition. This was addressed in February 2003 when a further question was added to the LFS to determine availability within the next four weeks, thus allowing the number of underemployed part-time workers (consistent with ILO definitions) to be measured. Using the information on the changes arising from the additional question being asked, it has been possible to develop synthetic estimates, using the full definition, for the period May 2001 to November 2002 to extend the QLFUR series back to May 2001 (end note 3).
Graph 1 shows the trend estimates of the QLFUR from May 2001. Also presented is the proxy underutilisation rate available from February 1978 to May 2006 (with a break in series at May 2001). This February 1978 to May 2006 series uses the broader measure for underemployed workers (part-time workers who prefer more hours), while the QLFUR series from May 2001 is consistent with the ILO definition (part-time workers who prefer more hours and are available in the reference week or within four weeks).
1. Labour force underutilisation rates, Persons
: Trend
- Feb 1978 - May 2008
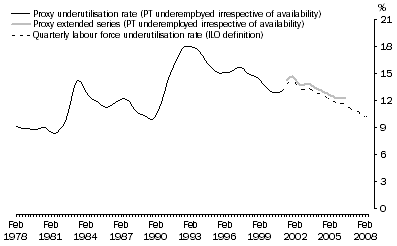
In the graph above, the February 1978 to February 2001 series has been extended to May 2006, to give an indication of the difference between the QLFUR and the proxy underutilisation rate. This extended series is higher than the QLFUR as it includes all part-time workers who prefer to work more hours, irrespective of whether they were available. However, as approximately 90% of part-time workers who prefer to work more hours in the period from May 2001 onwards were also available to work more hours (either in the reference week or within four weeks), the difference between the QLFUR and the proxy measure for the period from May 2001 to May 2006 is relatively small (less than one percentage point).
Fluctuations in the labour force underutilisation rate are closely associated with the economic cycle. The sharp rises in the proxy underutilisation rate in the early 1980s and again in the early 1990s both coincided with economic recessions in Australia. Similarly, the consistent downward trend in the labour force underutilisation rate following the peak of 1993 has occurred during a period of sustained economic growth.
COMPARISON WITH THE ANNUAL RATE
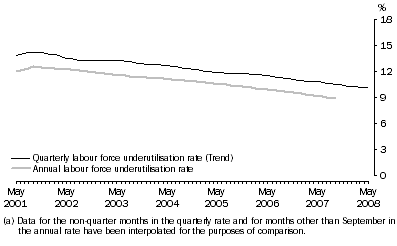
Prior to the introduction of the QLFUR, the annual Underemployed Workers Survey (UEW), conducted in September, has been one of the main sources for information on estimates of underutilisation rates. Comparison of the annual estimates and the quarterly series have identified some variations between these estimates. Specifically the QLFUR has been consistently higher than the annual labour force underutilisation rate in all periods that the quarterly data have been collected. Between May 2001 and May 2008, the quarterly trend labour force underutilisation rate for August (the closest quarter month to the annual series) was between 1.2 and 1.8 percentage points higher than the annual rate (Graph 2). The unemployed component of both the quarterly and annual labour force underutilisation rates are sourced from the LFS, and have been comparable over the period since May 2001. Therefore, the main reason for the difference between the quarterly and annual labour force underutilisation rate is the measure of underemployment from the different sources ie the monthly LFS and the annual UEW.
2. Labour force underutilisation rates(a), Persons
- May 2001 - May 2008
The ABS has identified that it is the difference in the proportion of part-time workers who preferred to work more hours which accounts for the difference between the quarterly and annual measure of labour underutilisation (Graph 3). Prior to April 2001, the question to determine this group was asked in the LFS each month and people were sequenced into the UEW survey in September based on their response (
end note 4). As graph 3 shows, in each September (from 1994 to 2000) there is a marked decrease in the proportion of part-time workers who preferred more hours. Although it could be argued that this simply shows a seasonal low, analysis of monthly data prior to 1994 shows no evidence of a seasonal low in September, but rather shows a low in May 1988 and May 1991 (when the UEW survey was previously conducted).
3. Proportion of part-time workers preferring to work more hours(a)
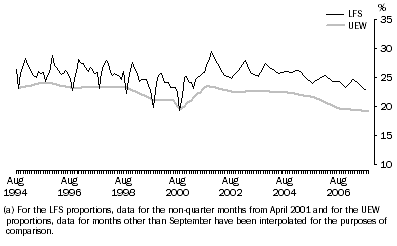
This supports the conclusion that the difference between the proportion of part-time workers preferring more hours in the quarterly series and the annual series is mainly due to a supplementary survey effect. A supplementary survey effect is said to occur when the collection of a survey (i.e. additional questions) has a measurable impact on the data collected due to either interviewer or respondent bias. It is suggested that the collection of the UEW survey may affect the way respondents answer questions relating to part-time workers preferring to work more hours.
In the UEW survey, when a respondent indicates that they (or the person for whom they are responding) prefer to work more hours, they are sequenced through up to 16 additional questions about what they would prefer to do to work the extra hours (such as working in a different occupation or moving interstate), and their job search activities. This is not the case in the LFS. Therefore, a person who wants to limit the time and effort required to complete the UEW survey may be inclined to alter their responses to the question regarding preference for more hours.
Although the UEW survey provides lower level estimates of underemployed people, it is still a valuable source of information about what they would prefer to do to work the extra hours (such as working in a different occupation or moving interstate) and their job search activities. It is also currently the only survey which looks at their spare capacity to work more hours to determine how many extra hours of work they can offer the labour market.
COMPONENTS OF THE QLFUR
In order to produce a quarterly labour force underutilisation rate it is necessary to produce a quarterly unemployment and underemployment rate. The ABS calculates seasonally adjusted and trend unemployment rates on a quarterly basis for the purposes of producing the QLFUR. As these estimates are derived only from data collected in the quarter months, they will differ slightly from the official monthly seasonally adjusted and trend unemployment rates published in Labour Force, Australia (cat. no. 6202.0) and associated electronic products. Although users will be able to derive seasonally adjusted and trend unemployment rates for quarter months from the QLFUR data, these should not be used in place of the official monthly estimates.
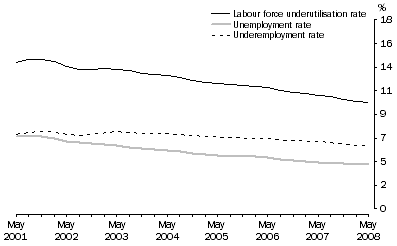
Graph 4 shows the relative contributions of unemployment and underemployment to the labour force underutilisation rate. In May 2001, the trend quarterly unemployment rate and trend quarterly underemployment rate contributed almost equally to the labour force underutilisation rate (6.8% and 7.1% respectively). That is, there were roughly equal numbers of unemployed and underemployed. Since that time, however, the trend quarterly unemployment rate has fallen by approximately 2.7 percentage points (to 4.2% in May 2008). The trend quarterly underemployment rate also fell over the period, although the decline was much less pronounced (1.1 percentage points to 6.0% in May 2008). The result of these trends is that the quarterly underemployment rate has assumed a larger proportion of the labour force underutilisation rate over time. Given that these trends have occurred during a period of sustained economic growth, this may reflect the fact that the unemployment rate is more sensitive to fluctuations in the economic cycle than the underemployment rate.
4. Quarterly measures of labour force underutilisation, Persons
: Trend
- May 2001 - May 2008
SEX
The quarterly labour force underutilisation rate has fallen considerably for both men and women over the period from May 2001 to May 2008. There have, however, been considerable differences between the level of the QLFUR for men and women (Graph 5).
5. Quarterly labour force underutilisation rate, by Sex
: Trend
- May 2001 - May 2008
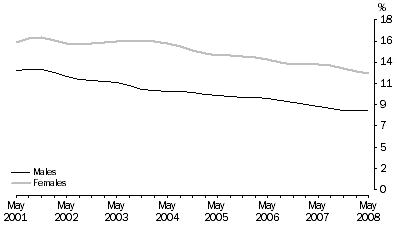
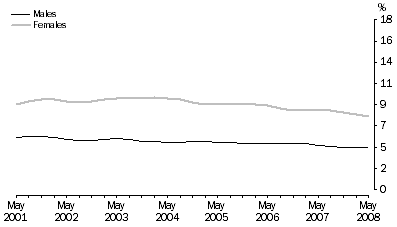
Since May 2001, the female trend labour force underutilisation rate has been consistently higher than that for males. The trend QLFUR rate for men has ranged between a high of 12.8% in August 2001 and a low of 8.4% in May 2008. The rate for women, on the other hand, varied between a high of 16.1% in November 2001 and a low of 12.3% in May 2008. The higher labour force underutilisation rate for women is largely due to the fact that the female trend quarterly underemployment rate has been considerably higher than the male rate for the entire period from May 2001 to May 2008 (Graph 6). In fact, while the trend quarterly unemployment rates for males and females have been relatively similar (Graph 7), the female trend quarterly underemployment rate has consistently been between 3.4 and 4.7 percentage points higher than the male rate.
6. Quarterly underemployment rate, by Sex
: Trend
- May 2001 - May 2008
 7. Quarterly unemployment rate,
 by Sex
: Trend
- May 2001 - May 2008
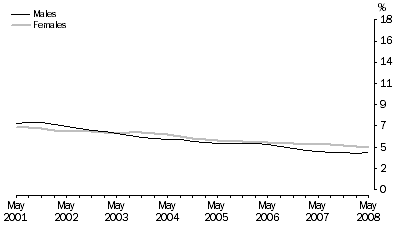
There have also been considerable differences between men and women in the relative contributions of unemployment and underemployment. While unemployment has historically been the main contributor to the male labour force underutilisation rate, a decline in the level of unemployment has seen an increase in the relative contribution of underemployment over time. Since May 2001, the male trend quarterly unemployment rate has fallen by 3.1 percentage points, while the quarterly underemployment rate has remained relatively steady (falling by 1.1 percentage points). As a result, the male trend quarterly underemployment rate has generally been higher than the male trend quarterly unemployment rate since November 2004.
The quarterly underemployment rate for females, by contrast, has been consistently higher than the female unemployment rate throughout the period from May 2001 to May 2008. This, in part, reflects the fact that women are more likely to work part time than men and that underemployment is largely associated with part-time work (end note 5).
AGE
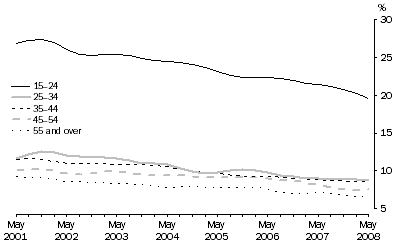
There is a marked difference in the QLFUR for people aged 15-24 years compared to other age groups (Graph 8). The quarterly trend labour force underutilisation rate for people aged 15-24 years was more than twice that for people in other age groups from May 2001 to May 2008. This may be due to the fact that young people, many of whom combine work with study, are more likely to be employed part time than those in older age groups. In May 2008, a large proportion (45%) of employed 15-24 year olds were working part time, and 72% of these were also studying full time. Younger people also have higher rates of unemployment than others.
8. Quarterly labour force underutilisation rate, by Age
: Trend
- May 2001 - May 2008
STATE AND TERRITORY
Graph 9 shows the QLFUR in May 2001 and May 2008 by state and territory. WA and the ACT had the lowest quarterly trend labour force underutilisation rates (7.2% and 7.4% respectively) in May 2008. The QLFUR fell across all states and territories, except the NT, between May 2001 and May 2008 with the largest falls occurring in Qld and WA.
9. Quarterly labour force underutilisation rate, by State/territory
: Trend
- May 2001 & May 2008
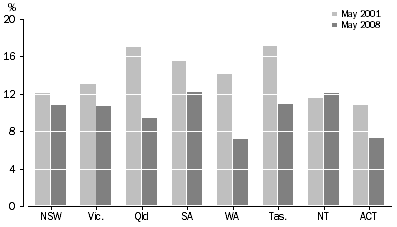
The table below shows the quarterly unemployment rate and the quarterly underemployment rate by state and territory in May 2001 and May 2008. For most states and territories (except WA and the NT), the decrease in the unemployment rate has been the main contributor to the decrease in the QLFUR. However, in WA, there was a slightly larger decrease in the underemployment rate (3.6 percentage points compared with 3.4 percentage points for the unemployment rate). For the NT the decrease in the unemployment rate was countered by a slightly larger increase in the underemployment rate.
10. Components of the QLFUR, By state and territory: Trend - May 2001 and May 2008 |
|  |
 | Unemployment rate | Underemployment rate |  |
 | May-01 | May-08 | Difference(a) | May-01 | May-08 | Difference(a) |  |
 | % | % | pp | % | % | pp |  |
|  |
| New South Wales | 6.0 | 4.6 | -1.5 | 6.0 | 6.3 | 0.2 |  |
| Victoria | 6.4 | 4.2 | -2.2 | 6.7 | 6.6 | -0.2 |  |
| Queensland | 8.6 | 3.8 | -4.8 | 8.5 | 5.6 | -2.9 |  |
| South Australia | 7.4 | 4.9 | -2.5 | 8.1 | 7.3 | -0.9 |  |
| Western Australia | 6.7 | 3.3 | -3.4 | 7.5 | 3.8 | -3.6 |  |
| Tasmania | 9.0 | 4.6 | -4.4 | 8.1 | 6.4 | -1.7 |  |
| Northern Territory | 7.1 | 3.9 | -3.2 | 4.5 | 8.2 | 3.6 |  |
| Australian Capital Territory | 5.2 | 2.6 | -2.6 | 5.6 | 4.8 | -0.8 |  |
| Australia | 6.8 | 4.2 | -2.7 | 7.1 | 6.0 | -1.1 |  |
|  |
| (a) Change is in percentage points. Discrepencies may occur due to rounding. |
DISSEMINATION
The quarterly labour force underutilisation rate is expected to be released in Labour Force, Australia, Detailed, Quarterly (cat. no. 6291.0.55.003) in the first half of 2009, as a time series spreadsheet containing original, seasonally adjusted and trend estimates for:
- males, females and persons by state and territory; and
- males, females and persons by age group (15-24, 25-34, 35-44, 45-54, 55 years and over, and all age groups).
The labour underutilisation tables (table 4.1 to 4.3) in the publication
Australian Labour Market Statistics (cat. no. 6105.0), which currently contain the annual measures, will be updated to reflect the new quarterly series for the October 2008 issue.
The publication of the annual labour force underutilisation rate will cease once the quarterly rate is released. However, the UEW will continue to run in September each year as it collects detailed information about the characteristics of underemployed workers.
Implications for other measures of labour underutilisation
The Extended Labour Force Underutilisation Rate (ELFUR) will continue to be published annually in the April edition of Australian Labour Market Statistics (cat. no. 6105.0). Consideration is being given to changing the reference month from September to August to maintain consistency with the QLFUR reference month. A review is also being conducted which is looking at the population groups of people not in the labour force (PNILF) currently included in the ELFUR, as well as investigating whether any additional PNILF population groups should be included.
Similarly, consideration is being given to publishing the annual experimental volume measures of labour underutilisation based on August, rather than September, LFS data. This would ensure that the reference period for the volume measures of labour underutilisation are consistent with the QLFUR.
FURTHER INFORMATION
For further information, please contact Tracey Chester (ph (02) 6252 5609 or email <tracey.chester@abs.gov.au>).
END NOTES
1.Current international standards (Sixteenth International Conference of Labour Statisticians, 1998) recognise two forms of underemployment: time-related underemployment, which reflects insufficient hours of work; and inadequate employment situations, such as insufficient use of skills and experience or inadequate income. Inadequate employment situations encompass a number of factors such as the skill level of workers and their attitudes to work which are not easily quantified. As such, the international standards do not define inadequate employment situations. <back
According to the international standard, time-related underemployment exists when the hours of work of an employed person are below a threshold, and are insufficient in relation to an alternative employment situation in which the person is willing and available to engage. In other words, a person is considered underemployed if they worked less than a particular threshold of hours and wanted and were available to work more hours.
Within these conceptual definitions, there is room for each country to specify operational definitions to suit the characteristics of the domestic labour market. See Glossary for ABS definitions of underemployment and unemployment.
2. From May 2001, the question used in the LFS to identify part-time workers who prefer to work more hours was changed. This may have resulted in a break in the series 'Part-time workers preferring to work more hours'. <back
3. Due to the synthetic nature of the estimates from May 2001 to November 2002 no further disaggregation of the QLFUR for this period is possible. From February 2003, further disaggregation of the data can be requested (such as QLFUR for each state by age), but the data will only be available as original series (subject to confidentiality). <back
4. The Underemployed Workers Survey has been collected annually in September from 1994. Prior to that the Survey was conducted in May 1985, May 1988 and May 1991. <back
5. Underemployed part-time workers have consistently made up around 90% of all underemployed workers since May 2001. <back
 Print Page
 Print All