PERMANENT DEPARTURES OVERSEAS — WHERE ARE THEY GOING?
INTRODUCTION
The permanent movement of Australians overseas effects the size of the Australian resident population, the labour force and the economy.
Permanent departures overseas are Australian residents who on departure from Australia state that they are departing permanently. They comprise people born in Australia and former settlers. Information on permanent departures is compiled from passenger cards collected each time a person leaves Australia. These passenger cards collect data on the stated intentions of people departing, including country of future residence. However, it should be noted that the stated intention does not always match an individuals actual travel behaviour.
Over the nine years ending 2006-07, permanent departures from Australia of both Australia-born and overseas-born are detailed in this article. Where those departing intend to settle and whether or not overseas-born departures intend to return to their country of birth is also discussed. The nine year time frame was chosen as collection and processing procedures were consistent throughout the period.
For this article the Australian Bureau of Statistics has used movement data from the Overseas Arrivals and Departures (OAD) collection. Statistics on OAD relate to the number of movements of travellers rather than the number of travellers (i.e. the multiple movements of individual persons during a given reference period are all counted). Therefore, care should be taken when interpreting this movement data as 'people'.
PERMANENT DEPARTURES
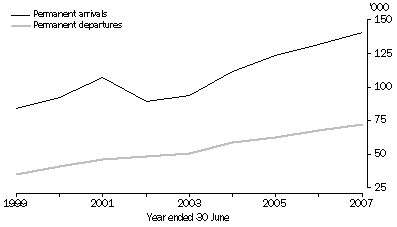
The number of permanent departures from Australia has doubled over the past nine years. In 1998-99, 35,200 movements were recorded with passengers stating that they intended to depart Australia permanently compared with 72,100 in 2006-07.
In the main, the growth of permanent departures and permanent arrivals have both experienced a steady rise overtime, although there was a decline of permanent arrivals in 2001-02. The level of permanent departures is also much lower than permanent arrivals as seen in Figure 5.1. The number of settler arrivals largely depends on the migration program levels set each year by the Australian Government. This program is administered by the Department of Immigration and Citizenship (DIAC).
5.1 PERMANENT ARRIVALS AND PERMANENT DEPARTURES, Australia

The migration of New Zealand citizens under the 1973 trans-Tasman Agreement also influences the number of permanent arrivals to Australia. The Department of Immigration and Citizenship (DIAC) notes 'The size of the movement of New Zealanders to and from Australia responds to relative economic conditions in Australia and New Zealand such as differences in relative real incomes and employment opportunities. The number of New Zealanders in Australia increases in times of relative economic buoyancy in Australia and declines when economic conditions are slower'
(footnote 1).
In 2000-01 the number of New Zealand citizens migrating to Australia reached 39% (42,000 persons) of all permanent arrivals, up from 34% in the previous year. This proportion fell to 24% in 2001-02 and 17% in 2002-03. The peak in 2000-01 and the subsequent dip in the following two years may have been influenced by the announcement on 26 February 2001 of the Australian and New Zealand governments bilateral social security arrangements. Additionally, DIAC noted that 'the fall also coincided with the improved New Zealand economy' (footnote 2).
Country of future residence
When comparing the years 1998-99 and 2006-07, the top six destinations for those departing Australia permanently remained the same. However, the proportion of those departing to the top four destinations decreased by 2006-07 (New Zealand, the United Kingdom, the United States of America and Hong Kong) while the proportion departing to Singapore and China increased.
The proportion of traveller movements departing to the United Arab Emirates increased from 0.9% in 1998-99 to 3.4% in 2006-07. By 2006-07 Indonesia had fallen from the top 10 destinations having been placed 8th in 1998-99.
5.2 PERMANENT DEPARTURES, Australia - Top 10 countries of future residence(a) |
|  |
 | 1998-99 | 2006-07 |  |
 | Rank | Number | Proportion | Rank | Number | Proportion |  |
| Country of future residence | no. | '000 | % | no. | '000 | % |  |
|  |
| New Zealand | 1 | 7.5 | 21.2 | 1 | 13.9 | 19.3 |  |
| United Kingdom | 2 | 6.8 | 19.3 | 2 | 13.1 | 18.2 |  |
| United States of America | 3 | 4.2 | 12.1 | 3 | 7.2 | 10.0 |  |
| Hong Kong (SAR of China) | 4 | 2.8 | 8.1 | 4 | 5.4 | 7.5 |  |
| Singapore | 5 | 1.3 | 3.6 | 5 | 4.1 | 5.7 |  |
| China (excludes SARs and Taiwan) | 6 | 1.1 | 3.1 | 6 | 4.1 | 5.7 |  |
| United Arab Emirates | 19 | 0.3 | 0.9 | 7 | 2.4 | 3.4 |  |
| Canada | 7 | 0.8 | 2.4 | 8 | 1.6 | 2.2 |  |
| Japan | 10 | 0.5 | 1.3 | 9 | 1.3 | 1.9 |  |
| Thailand | 15 | 0.4 | 1.1 | 10 | 1.3 | 1.7 |  |
| Other | . . | 9.5 | 26.9 | . . | 17.6 | 24.4 |  |
| Total | . . | 35.2 | 100.0 | . . | 72.1 | 100.0 |  |
|  |
| . . not applicable |
| (a) Ranking based on 2006-07. |
Country of birth
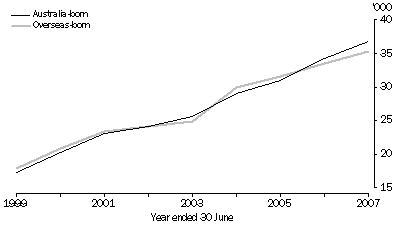
Over the past nine years the proportion of Australia-born and overseas-born residents departing Australia permanently has remained similar with each accounting for approximately half of all permanent departures.
5.3 PERMANENT DEPARTURES, Australia
- Country of birth

1 DIAC, Population Flows 2003–04 Edition, Chapter 4 New Zealand Movement—The trans-Tasman Travel Agreement, p45.
<back
2 DIAC, Population Flows 2003–04 Edition, Chapter 4 New Zealand Movement—Permanent Arrivals, p46.
<back
AUSTRALIA-BORN DEPARTURES
In 2006-07, there were 36,800 Australia-born residents (including Australia-born children whose parents were former settlers) who permanently departed Australia. This was double the number of Australia-born permanent departures in 1998-99 (17,300).
The United Kingdom, New Zealand and the United States of America were the top three destinations for Australia-born residents who departed Australia permanently in both 1998-99 and 2006-07. These three destinations comprised 58% of all Australia-born permanent departures in 1998-99 compared with 52% in 2006-07.
Eight of the top 10 destinations were represented in both 1998-99 and 2006-07. The two destinations which were absent from the top 10 in 2006-07 were Papua New Guinea (falling from 7th position in 1998-99 to 18th position in 2006-07) and Indonesia (falling from 10th position in 1998-99 to 11th position in 2006-07).
The United Arab Emirates and Thailand were the two countries to join the top 10 destinations for Australia-born permanent departures in 2006-07. The United Arab Emirates increased more than sevenfold over the nine year period ending June 2007 (up from 200 persons in 1998-99 to 1,700 persons in 2006-07) while Thailand increased threefold (up from 200 persons in 1998-99 to 600 persons in 2006-07).
5.4 AUSTRALIA-BORN PERMANENT DEPARTURES, Australia - Top 10 countries of future residence(a) |
|  |
 | 1998-99 | 2006-07 |  |
 | Rank | Number | Proportion | Rank | Number | Proportion |  |
| Country of future residence | no. | '000 | % | no. | '000 | % |  |
|  |
| United Kingdom | 1 | 3.8 | 22.1 | 1 | 8.3 | 22.4 |  |
| New Zealand | 2 | 3.3 | 19.0 | 2 | 5.7 | 15.4 |  |
| United States of America | 3 | 2.9 | 16.9 | 3 | 5.0 | 13.7 |  |
| Singapore | 5 | 0.8 | 4.5 | 4 | 2.5 | 6.9 |  |
| Hong Kong (SAR of China) | 4 | 0.8 | 4.8 | 5 | 2.0 | 5.6 |  |
| United Arab Emirates | 12 | 0.2 | 1.3 | 6 | 1.7 | 4.6 |  |
| China (excludes SARs and Taiwan) | 9 | 0.3 | 1.5 | 7 | 1.1 | 3.0 |  |
| Canada | 6 | 0.5 | 3.0 | 8 | 1.0 | 2.8 |  |
| Japan | 8 | 0.3 | 1.6 | 9 | 0.7 | 2.0 |  |
| Thailand | 15 | 0.2 | 1.1 | 10 | 0.6 | 1.7 |  |
| Other | . . | 4.2 | 24.3 | . . | 8.1 | 22.0 |  |
| Total | . . | 17.3 | 100.0 | . . | 36.8 | 100.0 |  |
|  |
| . . not applicable |
| (a) Ranking based on 2006-07. |
OVERSEAS-BORN DEPARTURES
Between 1998-89 and 2006-07, the number of overseas-born Australian residents departing doubled, increasing each year from 17,900 departures in 1998-99 to 35,300 departures in 2006-07.
The top three countries of future residence of overseas-born Australian residents departing permanently were the same in 1998-99 and 2006-07 (New Zealand, the United Kingdom and Hong Kong). These three countries comprised 51% of all overseas-born Australian residents departing permanently in 1998-99 compared with 47% in 2006-07.
While nine of the top 10 destinations were the same in both 1998-99 and 2006-07 the ranking and proportion of all overseas-born Australian residents departing permanently varied. When the two periods were compared, there was an increase in the proportion of people departing to China, Singapore, Viet Nam and the United Arab Emirates. For example, the proportion of overseas-born Australian residents departing to China rose almost four percentage points (4.6% in 1998-99 to 8.5% in 2006-07). The United Arab Emirates rose from 27th position in 1998-99 to 9th position in 2006-07, replacing Canada which was ranked in 9th position in 1998-99 and 13th position in 2006-07. The remaining top 10 countries decreased their proportional representation. For example, the United Kingdom decreased nearly three percentage points (16.6% in 1998-99 to 13.7% in 2006-07).
5.5 OVERSEAS-BORN PERMANENT DEPARTURES, Australia - Top 10 countries of future residence(a) |
|  |
 | 1998-99 | 2006-07 |  |
 | Rank | Number | Proportion | Rank | Number | Proportion |  |
| Country of future residence | no. | '000 | % | no. | '000 | % |  |
|  |
| New Zealand | 1 | 4.2 | 23.4 | 1 | 8.2 | 23.3 |  |
| United Kingdom | 2 | 3.0 | 16.6 | 2 | 4.8 | 13.7 |  |
| Hong Kong (SAR of China) | 3 | 2.0 | 11.3 | 3 | 3.4 | 9.6 |  |
| China (excludes SARs and Taiwan) | 5 | 0.8 | 4.6 | 4 | 3.0 | 8.5 |  |
| United States of America | 4 | 1.3 | 7.4 | 5 | 2.1 | 6.1 |  |
| Singapore | 7 | 0.5 | 2.7 | 6 | 1.6 | 4.6 |  |
| Viet Nam | 10 | 0.3 | 1.5 | 7 | 0.9 | 2.4 |  |
| Taiwan | 6 | 0.5 | 2.8 | 8 | 0.8 | 2.4 |  |
| United Arab Emirates | 27 | 0.1 | 0.5 | 9 | 0.7 | 2.1 |  |
| Indonesia | 8 | 0.4 | 2.0 | 10 | 0.7 | 1.9 |  |
| Other | . . | 4.9 | 27.1 | . . | 9.0 | 25.4 |  |
| Total | . . | 17.9 | 100.0 | . . | 35.3 | 100.0 |  |
|  |
| . . not applicable |
| (a) Ranking based on 2006-07. |
AGE AT DEPARTURE
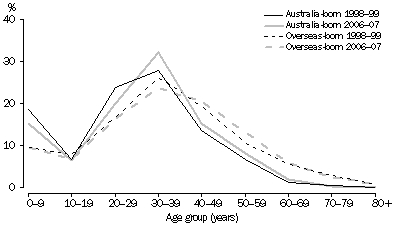
The age structure of the Australia-born and overseas-born permanent departures shows some variations. In both 1998-99 and 2006-07 the peak age group for Australia-born and overseas-born permanent departures was 30-39 years. This was followed by the 20-29 years age group for Australia-born and the 40-49 years age group for overseas-born. These age groups are comprised of people at prime working age.
5.6 PERMANENT DEPARTURES, Australia
- Age at departure

Overall, Australia-born departures are generally younger than overseas-born with 74% of Australia-born permanent departures being younger than 40 years in 2006-07 (77% in 1998-99) compared with 57% of overseas-born permanent departures (60% in 1998-99). Many children of overseas-born residents are likely to have been born in Australia and may result in a higher proportion of Australia-born resident departures being under 10 years of age.
RETURN MIGRATION AND STEP MIGRATION
Return migration relates to former settlers to Australia who depart Australia permanently to return to their country of birth. Reasons for return migration may include migrants who are unable to secure satisfactory employment; or conversely over the long-term those who return after successful employment and increased wealth; family formation and dissolution; cultural and/or religious ties; or when conditions have improved within their country of birth.
Step migration relates to former settlers to Australia who depart Australia permanently for a country other than their country of birth. Reasons for engaging in step migration are varied and may include circumstances preventing former migrants choosing to return to their country of birth (e.g. political instability, economic conditions); family formation and dissolution; cultural and/or religious ties; employment opportunities; or the long-term aim of some migrants to use Australia as a staging country to facilitate onward migration.
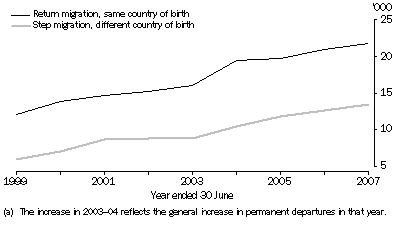
Traditionally, the majority of overseas-born residents departing Australia permanently are return migrants, those returning to their country of birth. However, while the number continues to increase in line with total overseas-born permanent departures, the proportion is gradually falling. In the nine year period ending June 2007 the proportion of former migrants returning to their country of birth fell from 67% in 1998-99 to 62% in 2006-07.
5.7 RETURN MIGRATION(a) AND STEP MIGRATION, Australia

Of the top 10 country of birth destinations in both 1998-99 and 2006-07, nine out of 10 countries showed that the majority of residents departing were choosing to return to their country of birth. In 1998-99 and 2006-07 Malaysia was the only country in the top 10 where the majority of former migrants chose not to return to their country of birth. The proportion of Malaysia-born residents choosing countries other than their birthplace increased nine percentage points (up from 65% in 1998-99 to 74% in 2006-07). In 2006-07 Malaysia-born residents chose Singapore (20%), the United Kingdom and Hong Kong (11% each), New Zealand (8%) and the United States of America (6%) as the main countries of future residence.
In 1998-99 and 2006-07 the number of migrants returning to their country of birth decreased for seven of the top 10 countries. The largest decreases were for Taiwan, Malaysia, the United Kingdom and the United States of America with the proportion of residents returning to their country of birth falling by approximately nine percentage points each. Conversely, the proportion of China-born and Viet Nam-born residents returning to their country of birth rose 12 percentage points and nine percentage points respectively.
5.8 RETURN MIGRATION AND STEP MIGRATION, Australia - Top 10 countries of birth |
|  |
 | Same future residence and birthplace | Different future residence and birthplace | Total overseas-born |  |
| Country of birth | % | % | '000 |  |
1998-99 |  |
|  |
| New Zealand | 83.7 | 16.3 | 3.8 |  |
| United Kingdom | 65.7 | 34.3 | 3.5 |  |
| China (excludes SARs and Taiwan) | 50.5 | 49.5 | 1.4 |  |
| Hong Kong (SAR of China) | 87.6 | 12.4 | 1.4 |  |
| United States of America | 81.0 | 19.0 | 0.6 |  |
| Taiwan | 85.9 | 14.1 | 0.5 |  |
| Viet Nam | 53.6 | 46.4 | 0.5 |  |
| Indonesia | 79.8 | 20.2 | 0.3 |  |
| Malaysia | 35.1 | 64.9 | 0.3 |  |
| Ireland | 69.6 | 30.4 | 0.3 |  |
| Other | 54.5 | 45.5 | 5.4 |  |
| Total | 67.2 | 32.8 | 17.9 |  |
2006-07 |  |
|  |
| New Zealand | 80.7 | 19.3 | 7.6 |  |
| United Kingdom | 56.7 | 43.3 | 5.6 |  |
| China (excludes SARs and Taiwan) | 62.3 | 37.7 | 4.0 |  |
| Hong Kong (SAR of China) | 80.4 | 19.6 | 2.1 |  |
| Viet Nam | 62.9 | 37.1 | 1.2 |  |
| United States of America | 72.3 | 27.7 | 1.0 |  |
| Taiwan | 76.8 | 23.2 | 1.0 |  |
| Indonesia | 74.4 | 25.6 | 0.7 |  |
| Malaysia | 26.2 | 73.8 | 0.6 |  |
| Korea Republic of (South) | 71.1 | 28.9 | 0.6 |  |
| Other | 45.8 | 54.2 | 10.9 |  |
| Total | 61.8 | 38.2 | 35.3 |  |
|  |
SUMMARY
Over the nine years ended June 2007 the number of permanent departures from Australia doubled. While the main destinations remained New Zealand, the United Kingdom and the United States of America the proportional representation of these three countries fell from 53% in 1998-99 to 47% in 2006-07.
Both Australia-born and overseas-born migrants departed Australia permanently with each group accounting for around 50% of all permanent departures over the nine year period.
The peak age group at departure was 30-39 years, for both Australia-born and overseas-born. However, Australia-born migrants were generally younger than overseas-born migrants.
While overseas-born migrants traditionally return to their country of birth, the proportion choosing to do so decreased; falling from 67% in 1998-99 to 62% in 2006-07.
 Print Page
 Print All
 Quality Declaration