|
|
SOUTH AUSTRALIA
SUMMARY OF FINDINGS
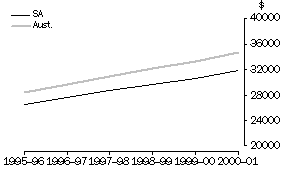
For the financial year 2000-01, the average individual annual wage and salary income for wage and salary earners in South Australia was $31,837. This was an increase of 3.8% over the previous year ($30,682) and an overall 19.9% increase on the average in 1995-96 ($26,542). The annual average rate of increase over the last five years has been 3.7%.
Average earnings for employees in South Australia in 2000-01 were the second lowest in the nation, around $2,900 less than the average for all wage and salary earners across Australia. In 1995-96 the difference between the Australian and South Australian averages was around $1,950.
Total wage and salary income paid to the state's wage and salary earners increased from $14.6 billion in 1995-96 to $17.6 billion in 2000-01, an increase of 21.0% overall or an average annual rate of increase of 3.9%. From 1999-00 to 2000-01 the increase was 3.7% (up from $17.0 billion). Over the five year period from 1995-96 the number of wage and salary earners have increased by 0.9%, from around 548,260 persons to 553,190 persons.
AVERAGE ANNUAL WAGE AND SALARY INCOME,
South Australia and Australia, 1995-96 to 2000-01
 Source: ATO Income Tax Data.
METROPOLITAN AND NON-METROPOLITAN SOUTH AUSTRALIA
In 2000-01, 75.7% of the state's wage and salary earners resided in metropolitan SA (i.e. Adelaide Statistical Division). This was down slightly from the proportion in 1995-96 (76.1%). Metropolitan SA comprised 74.1% of the state's population aged 15 years and over at both 30 June 1996 and 30 June 2001.
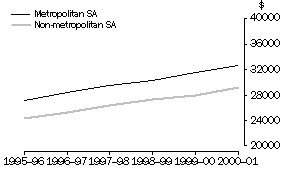
The average wage and salary income for persons in the metropolitan area in 2000-01 was $32,662, or 11.8% more than the average for employees in non-metropolitan areas. This percentage difference has remained relatively the same over the five year period since 1995-96.
WAGE AND SALARY EARNERS, Metropolitan(a) and non-metropolitan South Australia, 1995-96 to 2000-01
 |  |  |  |  |  |  | % Change |
 |  |  |  |  |  |  |
|
 | 1995-96 | 1996-97 | 1997-98 | 1998-99 | 1999-00 | 2000-01 | 1999-00 to 2000-01 | 1995-96 to 2000-01(b) |
|
WAGE AND SALARY EARNERS (no.) |
|
| Metropolitan SA | 417,167 | 413,112 | 418,009 | 419,363 | 419,110 | 418,815 | -0.1 | 0.1 |
| Non-metropolitan SA | 129,660 | 128,976 | 131,513 | 132,098 | 133,322 | 133,162 | -0.1 | 0.5 |
| Total SA(c) | 548,257 | 543,410 | 550,771 | 552,788 | 553,771 | 553,194 | -0.1 | 0.2 |
|
WAGE AND SALARY INCOME ($m) |
|
| Metropolitan SA | 11,356.6 | 11,713.1 | 12,332.5 | 12,746.1 | 13,216.5 | 13,679.4 | 3.5 | 3.8 |
| Non-metropolitan SA | 3,152.7 | 3,265.6 | 3,477.4 | 3,613.1 | 3,728.2 | 3,888.9 | 4.3 | 4.3 |
| Total SA(c) | 14,552.1 | 15,019.0 | 15,849.9 | 16,404.9 | 16,990.8 | 17,611.9 | 3.7 | 3.9 |
|
AVERAGE WAGE AND SALARY INCOME ($) |
|
| Metropolitan SA | 27,223 | 28,353 | 29,503 | 30,394 | 31,535 | 32,662 | 3.6 | 3.7 |
| Non-metropolitan SA | 24,315 | 25,319 | 26,441 | 27,351 | 27,964 | 29,204 | 4.4 | 3.7 |
| Total SA(c) | 26,542 | 27,638 | 28,778 | 29,677 | 30,682 | 31,837 | 3.8 | 3.7 |
 |  |  |  |  |  |  |  |  |
| Metropolitan/non-metropolitan difference(d) (%) | 12.0 | 12.0 | 11.6 | 11.1 | 12.8 | 11.8 | - | - |
|
(a) Metropolitan SA is defined as comprising the Adelaide Statistical Division.
(b) Average annual rate of increase.
(c) Total includes data that could not be allocated to either metropolitan or non-metropolitan.
(d) Non-metropolitan SA used as denominator to calculate percentage difference.
Note: Indigenous persons engaged in CDEP projects may be included in the above data for the years 1995-96 to 1997-98 and excluded for 1998-99 onwards. Consequently changes between 1997-98 and 1998-99 and 1995-96 and 2000-01 in particular need to be treated with caution. For further details please refer to the Explanatory Notes.
Source: ATO Income Tax Data.
AVERAGE ANNUAL WAGE AND SALARY INCOME,
Metropolitan and non-metropolitan South Australia, 1995-96 to 2000-01
 Source: ATO Income Tax Data.
LOCAL GOVERNMENT AREAS
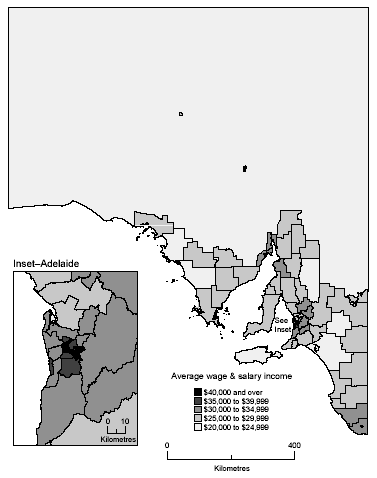
In 2000-01, the local government area with the highest average wage and salary income in South Australia was Roxby Downs (M) with an annual average of $47,166, significantly higher than Burnside ($41,089), the LGA with the second highest average in the state. Roxby Downs is well known for its copper and uranium mining and the high average is indicative of the high wages paid to many persons engaged in the mining industry.
Most of the top ten LGAs with the highest average wage and salary incomes in 2000-01 are located in the inner Adelaide area. These include Walkerville ($40,709), Adelaide ($40,272) and Unley ($39,694). Whyalla, with an average of $34,763, was the only other non-metropolitan LGA (in addition to Roxby Downs) in the top ten.
Of the 68 local government areas in the state, fifteen had averages above that for the state ($31,837) while ten had averages above the national figure ($34,745).
LGAs WITH HIGHEST AVERAGE ANNUAL WAGE AND SALARY INCOME, South Australia, 2000-01
| LGA Code | LGA Name | $ |
|
| 46970 | Roxby Downs (M) | 47,166 |
| 40700 | Burnside (C) | 41,089 |
| 48260 | Walkerville (M) | 40,709 |
| 40070 | Adelaide (C) | 40,272 |
| 47980 | Unley (C) | 39,694 |
|
Source: ATO Income Tax Data.
Streaky Bay district council, on the state's far west coast, recorded the lowest annual average wage and salary income in 2000-01 ($23,225), while the neighbouring LGA of Elliston had the third lowest average ($24,188). Karoonda East Murray and The Coorong district councils in the state's Murray Mallee district had the second and fourth lowest averages with $23,816 and $24,580 respectively. It should be noted that these LGAs are predominantly agricultural districts and the wage and salary data presented here excludes persons in their own business such as farmers and other local business owners who are not wage and salary earners.
LGAs WITH LOWEST AVERAGE ANNUAL WAGE AND SALARY INCOME, South Australia, 2000-01
| LGA Code | LGA Name | $ |
|
| 47490 | Streaky Bay (DC) | 23,225 |
| 43080 | Karoonda East Murray (DC) | 23,816 |
| 41750 | Elliston (DC) | 24,188 |
| 47800 | The Coorong (DC) | 24,580 |
| 42750 | Kangaroo Island (DC) | 24,825 |
|
Source: ATO Income Tax Data.
AVERAGE ANNUAL WAGE AND SALARY INCOME, LGAs, South Australia, 2000-01
 Source: ATO Income Tax Data.
WAGE AND SALARY EARNERS, LGAs, South Australia, 1999-2000 and 2000-01
 |  |  |  | 1999-2000 |  |  | 2000-01 |
 |  |
|
|
| LGA Code | LGA Name | Wage and salary earners | Wage and salary income | Average wage and salary income | Wage and salary earners | Wage and salary income | Average wage and salary income |
 |  | no. | $m | $ | no. | $m | $ |
|
| 40070 | Adelaide (C) | 5,370 | 210.4 | 39,172 | 5,492 | 221.2 | 40,272 |
| 40120 | Adelaide Hills (DC) | 15,821 | 523.2 | 33,071 | 15,850 | 541.5 | 34,165 |
| 40220 | Alexandrina (DC) | 5,256 | 140.3 | 26,701 | 5,356 | 146.7 | 27,385 |
| 40310 | Barossa (DC) | 7,694 | 230.8 | 29,992 | 7,759 | 243.0 | 31,315 |
| 40430 | Barunga West (DC) | 536 | 13.2 | 24,684 | 509 | 13.7 | 26,886 |
| 40520 | Berri and Barmera (DC) | 4,189 | 110.2 | 26,315 | 4,260 | 115.9 | 27,218 |
| 40700 | Burnside (C) | 16,041 | 629.7 | 39,256 | 15,840 | 650.8 | 41,089 |
| 40910 | Campbelltown (C) | 17,536 | 541.1 | 30,856 | 17,404 | 555.2 | 31,903 |
| 41010 | Ceduna (DC) | 1,199 | 31.5 | 26,308 | 1,184 | 31.7 | 26,795 |
| 41060 | Charles Sturt (C) | 37,547 | 1,162.6 | 30,963 | 37,096 | 1,194.6 | 32,203 |
| 41140 | Clare and Gilbert Valleys (DC) | 2,793 | 71.3 | 25,534 | 2,755 | 74.4 | 26,991 |
| 41190 | Cleve (DC) | 565 | 13.6 | 24,058 | 532 | 13.6 | 25,514 |
| 41330 | Coober Pedy (DC) | 518 | 13.2 | 25,393 | 530 | 13.6 | 25,633 |
| 41560 | Copper Coast (DC) | 2,577 | 66.9 | 25,975 | 2,631 | 71.2 | 27,065 |
| 41750 | Elliston (DC) | 313 | 6.7 | 21,531 | 305 | 7.4 | 24,188 |
| 41830 | Flinders Ranges (DC) | 508 | 13.8 | 27,137 | 531 | 15.5 | 29,240 |
| 41960 | Franklin Harbor (DC) | 345 | 8.3 | 24,041 | 333 | 9.0 | 26,907 |
| 42030 | Gawler (M) | 6,709 | 202.5 | 30,178 | 6,829 | 215.0 | 31,487 |
| 42110 | Goyder (DC) | 1,226 | 27.1 | 22,065 | 1,153 | 28.7 | 24,913 |
| 42250 | Grant (DC) | 2,837 | 81.8 | 28,824 | 2,806 | 84.2 | 30,008 |
| 42600 | Holdfast Bay (C) | 12,696 | 427.3 | 33,658 | 12,766 | 449.6 | 35,222 |
| 42750 | Kangaroo Island (DC) | 1,354 | 32.8 | 24,221 | 1,466 | 36.4 | 24,825 |
| 43080 | Karoonda East Murray (DC) | 315 | 6.5 | 20,674 | 275 | 6.5 | 23,816 |
| 43220 | Kimba (DC) | 353 | 8.3 | 23,531 | 340 | 9.1 | 26,908 |
| 43360 | Lacepede (DC) | 718 | 18.0 | 25,083 | 726 | 18.9 | 25,990 |
| 43570 | Le Hunte (DC) | 475 | 10.7 | 22,599 | 446 | 11.3 | 25,394 |
| 43650 | Light (DC) | 3,645 | 105.3 | 28,882 | 3,665 | 110.7 | 30,202 |
| 43710 | Lower Eyre Peninsula (DC) | 1,152 | 27.9 | 24,247 | 1,077 | 28.7 | 26,679 |
| 43790 | Loxton Waikerie (DC) | 4,595 | 111.5 | 24,262 | 4,553 | 117.0 | 25,688 |
| 43920 | Mallala (DC) | 2,598 | 73.8 | 28,395 | 2,641 | 78.1 | 29,555 |
| 44060 | Marion (C) | 29,801 | 909.3 | 30,514 | 29,995 | 944.7 | 31,495 |
| 44210 | Mid Murray (DC) | 2,525 | 62.3 | 24,681 | 2,508 | 64.7 | 25,814 |
| 44340 | Mitcham (C) | 24,898 | 860.2 | 34,549 | 24,831 | 889.5 | 35,821 |
| 44550 | Mount Barker (DC) | 8,725 | 261.8 | 30,003 | 8,911 | 277.4 | 31,125 |
| 44620 | Mount Gambier (C) | 9,423 | 280.7 | 29,792 | 9,313 | 285.9 | 30,700 |
| 44830 | Mount Remarkable (DC) | 798 | 20.0 | 25,121 | 768 | 20.7 | 26,924 |
| 45040 | Murray Bridge (RC) | 5,349 | 137.0 | 25,605 | 5,388 | 143.7 | 26,674 |
| 45090 | Naracoorte and Lucindale (DC) | 3,385 | 86.4 | 25,532 | 3,279 | 87.8 | 26,769 |
| 45120 | Northern Areas (DC) | 1,311 | 32.2 | 24,531 | 1,220 | 32.9 | 26,936 |
| 45290 | Norwood Payneham St Peters (C) | 12,810 | 461.2 | 36,006 | 12,750 | 477.9 | 37,483 |
| 45340 | Onkaparinga (C) | 59,024 | 1,737.1 | 29,431 | 59,143 | 1,794.7 | 30,345 |
| 45400 | Orroroo/Carrieton (DC) | 315 | 7.6 | 24,137 | 315 | 8.2 | 25,972 |
| 45540 | Peterborough (DC) | 457 | 11.6 | 25,437 | 439 | 11.5 | 26,151 |
| 45680 | Playford (C) | 21,175 | 601.3 | 28,395 | 21,153 | 617.9 | 29,209 |
| 45890 | Port Adelaide Enfield (C) | 34,179 | 1,012.2 | 29,615 | 34,244 | 1,048.1 | 30,608 |
| 46090 | Port Augusta (C) | 4,494 | 131.5 | 29,250 | 4,550 | 139.4 | 30,627 |
| 46300 | Port Lincoln (C) | 4,748 | 135.4 | 28,521 | 4,723 | 140.7 | 29,794 |
| 46450 | Port Pirie City and Dists (M) | 5,202 | 154.1 | 29,625 | 5,255 | 160.8 | 30,593 |
| 46510 | Prospect (C) | 7,602 | 260.4 | 34,255 | 7,642 | 274.4 | 35,911 |
| 46670 | Renmark Paringa (DC) | 3,612 | 90.5 | 25,052 | 3,592 | 93.4 | 26,006 |
| 46860 | Robe (DC) | 438 | 10.8 | 24,576 | 441 | 11.1 | 25,082 |
| 46970 | Roxby Downs (M) | 1,903 | 86.7 | 45,570 | 1,980 | 93.4 | 47,166 |
| 47140 | Salisbury (C) | 42,986 | 1,229.8 | 28,610 | 43,130 | 1,273.8 | 29,534 |
| 47290 | Southern Mallee (DC) | 709 | 16.2 | 22,918 | 661 | 16.8 | 25,392 |
| 47490 | Streaky Bay (DC) | 656 | 14.6 | 22,295 | 678 | 15.7 | 23,225 |
| 47630 | Tatiara (DC) | 2,709 | 69.0 | 25,484 | 2,662 | 71.0 | 26,654 |
| 47700 | Tea Tree Gully (C) | 43,866 | 1,361.6 | 31,041 | 44,075 | 1,413.8 | 32,077 |
| 47800 | The Coorong (DC) | 1,738 | 39.1 | 22,505 | 1,627 | 40.0 | 24,580 |
| 47910 | Tumby Bay (DC) | 710 | 17.5 | 24,660 | 694 | 18.5 | 26,666 |
| 47980 | Unley (C) | 15,140 | 574.0 | 37,915 | 14,864 | 590.0 | 39,694 |
| 48050 | Victor Harbor (DC) | 2,664 | 66.6 | 25,016 | 2,730 | 70.0 | 25,657 |
| 48130 | Wakefield (DC) | 1,826 | 44.3 | 24,263 | 1,777 | 46.1 | 25,918 |
| 48260 | Walkerville (M) | 2,602 | 104.3 | 40,093 | 2,570 | 104.6 | 40,709 |
| 48340 | Wattle Range (DC) | 4,496 | 135.7 | 30,175 | 4,418 | 136.8 | 30,974 |
| 48410 | West Torrens (C) | 19,287 | 589.9 | 30,586 | 19,165 | 610.7 | 31,863 |
| 48540 | Whyalla (C) | 7,503 | 250.9 | 33,439 | 7,472 | 259.8 | 34,763 |
| 48750 | Yankalilla (DC) | 1,054 | 27.1 | 25,714 | 1,055 | 28.2 | 26,728 |
| 48830 | Yorke Peninsula (DC) | 2,566 | 63.7 | 24,842 | 2,537 | 65.8 | 25,955 |
| 49399 | Unincorporated SA | 2,265 | 69.4 | 30,620 | 2,312 | 74.7 | 32,330 |
| 49999 | LGA Unknown | 1,339 | 46.2 | 34,495 | 1,217 | 43.7 | 35,875 |
 | Total South Australia | 553,771 | 16,990.8 | 30,682 | 553,194 | 17,611.9 | 31,837 |
|
Source: ATO Income Tax Data.
|
 Print Page
 Print All