OUTPUT
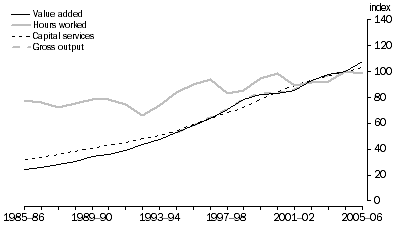
Value added in Communication services has displayed significant volume growth, averaging approximately 8% per year since 1985-86 (figure 12.2). Value added growth has been positive for the entire period between 1985-86 and 2005-06. Growth slowed slightly between 1998-99 and 2001-02, but still continued to grow at over 3% per year.
Despite the strong growth in output volumes in the Communications services industry, its contribution to GDP in current prices has fallen from 3.3% in 1993-94 to 2.7% in 2005-06, indicating that there has been a rapid fall in output prices. Information and communications technologies form a significant component of the assets used by this industry as capital inputs and it is likely that the large fall in the price level for these assets is likely to have significantly reduced marginal costs within the industry. The fall in marginal costs will have contributed to a reduction in the output price level.
There have been significant changes in the services provided by this industry. In 1985-86 the two major outputs were traditional wired telephony services and postal services. By 2005-06 the industry also offered mobile telephone services, satellite communications and the provision of both wired and wireless internet services. Postal services have also represented a declining a share of industry output. Compositional change can have an effect on productivity measurement because of different requirements for labour, capital and intermediate inputs of each product.
12.2 COMMUNICATION SERVICES OUTPUTS AND INPUTS, (2004-05 = 100)

 Print Page
 Print All
 Print Page
 Print All