|
|
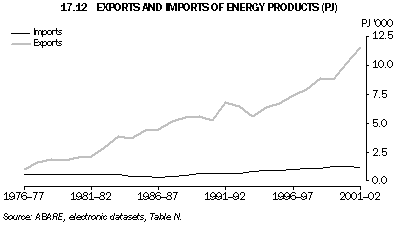
Australia is a net exporter of coal, LPG, natural gas and uranium. In 2000-01, a total of 11,627 PJ of Australian energy products were exported, comprising 11 458 PJ of primary energy and 170 PJ of derived energy (table 17.11). In terms of energy content, the largest contributors were black coal (47% of total energy exports) and uranium (39%). Crude oil and natural gas contributed 8% and 4%, respectively. Total energy exports (primary plus derived) increased by 121% between 1989-90 and 2000-01. Over this period, exports of primary energy products grew rapidly, particularly uranium (up 161%) and black coal (up 86%). The major derived energy products exported in 2000-01 were aviation turbine fuel (27.8 PJ), diesel (49 PJ) and automotive gasoline (44 PJ).
In contrast, imports of energy products are small (1,190 PJ in 2000-01). Australia is a net importer of crude oil, importing over 1,000 PJ in 2000-01, up 126% since 1989-90. Graph 17.12 shows the sharp contrast between exports of energy products from and imports of these products into Australia over more than 25 years.
17.11 ENERGY PRODUCTS, Volume of exports and imports
|
 |  | Exports |  | Imports |
 |  |
|  |
|
 |  | 1989-90 | 1995-96 | 2000-01 |  | 1989-90 | 1995-96 | 2000-01 |
 | PJ | PJ | PJ |  | PJ | PJ | PJ |
|
| Primary energy products |  |  |  |  |  |  |  |
 | Black coal | 2,965.6 | 3,947.7 | 5,517.6 |  | - | - | - |
 | Crude oil and ORF(a) | 266.5 | 403.3 | 889.6 |  | 449.0 | 917.3 | 1,019.5 |
 | LPG | 52.6 | 38.9 | 71.6 |  | 2.2 | 10.5 | 16.3 |
 | Natural gas | 109.3 | 407.0 | 409.6 |  | - | - | - |
 | Uranium | 1,749.8 | 2,484.4 | 4,569.3 |  | - | - | - |
 | Total | 5,143.8 | 7,281.3 | 11,457.7 |  | 451.2 | 927.8 | 1,035.8 |
| Derived energy products |  |  |  |  |  |  |  |
 | Automotive gasoline | 7.2 | 38.6 | 44.1 |  | 54.5 | 14.4 | 40.7 |
 | Aviation gasoline | 2.8 | 2.3 | 0.9 |  | 0.3 | 0.0 | 0.0 |
 | Aviation turbine fuel | 19.9 | 20.3 | 27.8 |  | 8.6 | 11.1 | 14.3 |
 | ADO and IDF(b) | 29.3 | 46.4 | 49.3 |  | 39.8 | 42.9 | 43.6 |
 | Fuel oil and kerosene | 18.8 | 25.9 | 29.1 |  | 46.9 | 28.6 | 33.2 |
 | Other petroleum products(c) | 19.5 | 26.3 | 18.0 |  | 24.3 | 18.9 | 22.4 |
 | Briquettes | 0.7 | 2.2 | 0.0 |  | - | - | - |
 | Coke | 15.5 | 11.4 | 0.5 |  | - | - | - |
 | Total | 113.7 | 173.4 | 169.7 |  | 174.4 | 115.9 | 154.2 |
| Total | 5,257.5 | 7,454.7 | 11,627.4 |  | 625.6 | 1,043.7 | 1,190.0 |
|
(a) Other refinery feedstock.
(b) Automotive diesel oil and industrial diesel fuel.
(c) Also includes lubricants and greases, bitumen and other bitumous products, solvents, waste oils and diesel. |
 |  |  |  |  |  |  |  |  |
| Source: ABARE, electronic datasets 2001, Table N. |

17.13 ENERGY PRODUCTS, Value of exports and imports
|
 | Exports |  | Imports |
 |
|  |
|
 | 1993-94 | 1997-98 | 2001-02 |  | 1993-94 | 1997-98 | 2001-02 |
| Fuel | $m | $m | $m |  | $m | $m | $m |
|
| Black coal(a) | 7,161 | 9,531 | 13,323 |  | - | - | - |
| Crude oil and ORF(b) | 1,424 | 2,251 | 6,422 |  | 2,803 | 3,697 | 7,454 |
| LPG | 138 | 367 | 720 |  | 19 | 68 | 117 |
| LNG | 1,047 | 1,599 | 2,636 |  | - | - | - |
| Uranium | 193 | 288 | 361 |  | - | - | - |
| Automotive gasoline | 172 | 304 | 405 |  | 750 | 93 | 450 |
| Diesel fuel(c) | 210 | 270 | 315 |  | 153 | 149 | 413 |
| Other refinery products | 964 | 1,079 | 1,321 |  | 392 | 431 | 596 |
| Total | 11,309 | 15,689 | 25,503 |  | 4,117 | 4,437 | 9,030 |
| Total trade in goods and services | 64,548 | 87,768 | 121,176 |  | 64,470 | 90,684 | 119,681 |
|
(a) Coking plus steaming.
(b) Other refinery feedstock.
(c) Includes automotive diesel oil and industrial and marine diesel fuel. |
 |  |  |  |  |  |  |  |
| Source: International Merchandise Trade, Australia (5422.0). |
|
 Print Page