PRODUCTIVITY
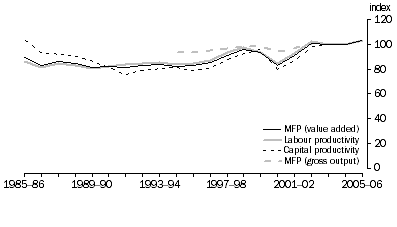
Multifactor productivity (MFP) growth for the industry on a value added basis averaged 0.7% per year between 1985-86 and 2005-06, which is below the market sector MFP growth of 1.2% per year. MFP growth picked up in the mid 1990s, although there was a temporary dip in 2000-01, which is partly due to a timing anomaly associated with the introduction of the GST.
Figure 7.1 presents MFP, labour productivity and capital productivity measures for the Construction industry. Labour productivity and MFP show similar patterns of growth, growing slowly over most of the period from 1985-86. Capital productivity at first declined in the late 1980s, then increased to 2005-06. The decline of all three measures in 2000-01 was due to the introduction of the GST, which influenced the time at which construction activity was undertaken leading to weaker output in 2000-01.
The gross output based MFP measure for the period 1994-95 to 2004-05 is also shown in figure 7.1. The figure shows growth in gross output based MFP being flat, except in 2000-01. The decline in gross output based MFP in 2000-01 was not as much as value added based MFP due to the significant contribution intermediate inputs makes to gross output MFP. The intermediate inputs cost share of total inputs was approximately 70% in 2005-06 with intra-industry transfers accounting for 37% of this. The reason for this high proportion of intra-industry transfers is due to the large number of sub-contractors working in this industry.
7.1 Construction MFP, labour productivity and capital productivity, (2004-05 = 100)

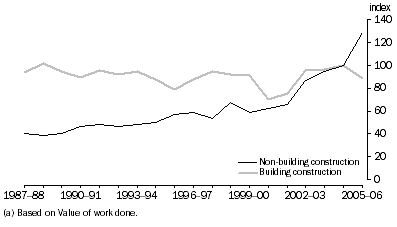
Figure 7.2 shows that value of work done per hour worked in the non-building construction industry has trended upwards from 1987-88 to 2005-06. The value of the work done includes costs of materials, labour etc., and is closer in concept to turnover, rather than value added. The building construction industry's value of work done per hour worked has been relatively flat for much of this period, although since 2001-02 there has been some growth.
The estimates in figure 7.2 are not fully comparable to the industry division estimates in figure 7.1 because the value of work done (output measure) is not the same as value added. Further, the hours worked excludes construction trade services, which has a significant employment share. However, it indicates that the modest growth rate in labour productivity of 0.9% per year for the industry as a whole is held back by a longer term decline in building construction value of work done per hour worked.
7.2 Value of work done per hour worked, Building construction and Non-building construction (a) (2004-05 = 100)

Another issue that may affect productivity growth in the Construction industry is changes over time in the geographic locations where engineering and non-building construction are undertaken. The higher intermediate input cost associated with major construction projects in remote areas may cause gross output measures of productivity to be lower.
 Print Page
 Print All