RESOURCES
Australia has large identified resources of fossil fuels and uranium. It is ranked in the top six countries in the world for economic demonstrated resources (EDR) of black and brown coal, and has the world's largest EDR of uranium. Australia also has significant reserves of natural gas and crude oil. For a more detailed outline on Australia's energy and mineral resources, see the Mining chapter.
Australia has substantial resources of high quality black coal. At June 2005, the EDR of black coal totalled 1,058,400 petajoules (PJ), with most of these resources located in New South Wales and Queensland. Small but locally important black coal resources occur in Western Australia, South Australia and Tasmania. Brown coal occurs mainly in Victoria with other deposits in Western Australia, South Australia and Tasmania.
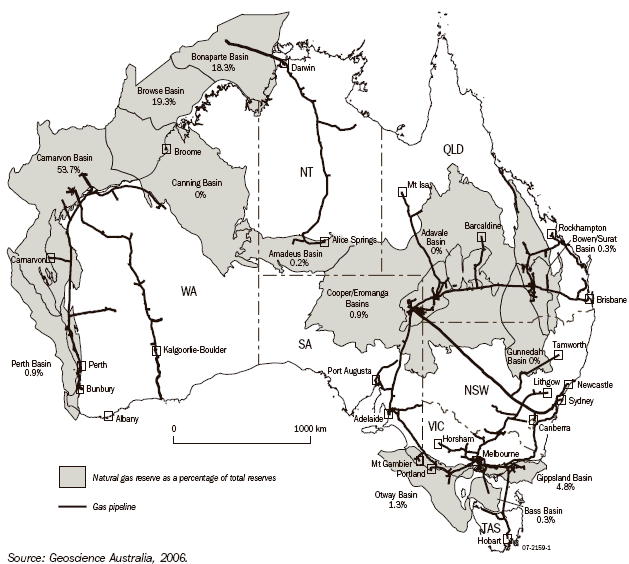
Map 19.1 shows the extent of access to gas resources and major transmission pipelines in Australia. At June 2005, the EDR of natural gas totalled 103,480 PJ (table 19.2), with the Carnarvon Basin accounting for over 50% of total reserves. The total length of Australia's transmission pipeline system has increased from 9,000 kilometres (km) in 1989 to almost 29,000 km in 2005. The natural gas distribution network reaches 3.7 million customers, including 3.6 million domestic customers and 100,000 commercial and industrial customers.
19.1 Gas reserves and pipelines - January 2006

In the period 1995-2005 the EDR of black coal, brown coal, and crude oil each decreased, while the EDR of liquefied petroleum gas (LPG), condensate, natural gas and uranium each increased (table 19.2). Changes in EDRs can result from production activity, new discoveries, or the reclassification of existing resources.
19.2 ECONOMIC DEMONSTRATED RESOURCES OF PRIMARY ENERGY PRODUCTS(a) - 30 June |
|  |
 | 1995 | 2005 | Change from 1995 to 2005 |  |
| Fuel | PJ | PJ | % |  |
|  |
| Black coal | 1 331 100 | 1 058 400 | -20.5 |  |
| Brown coal | 399 640 | 362 780 | -9.2 |  |
| Crude oil | 9 546 | 5 809 | -39.1 |  |
| Condensate | 6 031 | 11 137 | 84.7 |  |
| LPG | 4 333 | 5 671 | 30.9 |  |
| Natural gas | 50 880 | 103 480 | 103.4 |  |
| Uranium | 293 985 | 336 520 | 14.5 |  |
|  |
| (a) Non-renewable resources only. |
| Source: Australian System of National Accounts (5204.0). |
The net present value (NPV) of an energy resource is the expected value of the resource based on current market value, with some modifications based on depletion and economic forces. At June 2005, the NPV of Australian energy and mineral resources was $175 billion (b) (table 19.3). The energy resources with the highest NPV were natural gas and black coal, accounting for 38% and 30% of the total NPV of energy resources respectively. In the period 1995-2005, the value of energy resources in Australia increased from $76b to $175b (up by 229%).
19.3 NET PRESENT VALUE OF PRIMARY ENERGY RESOURCES - 30 June |
|  |
 | 1995 | 2005 | Change from 1995 to 2005 |  |
| Fuel | $m | $m | % |  |
|  |
| Black coal | 12 824 | 52 423 | 408.8 |  |
| Brown coal | 488 | 708 | 145.1 |  |
| Crude oil | 16 942 | 25 201 | 148.7 |  |
| Condensate | 4 946 | 18 432 | 372.7 |  |
| LPG(a) | 2 179 | 9 795 | 449.5 |  |
| Natural gas | 37 520 | 66 720 | 177.8 |  |
| Uranium | 1 535 | 1 919 | 125.0 |  |
| Total | 76 434 | 175 198 | 229.2 |  |
|  |
| (a) Naturally occurring. |
| Source: Australian System of National Accounts (5204.0). |
 Print Page