ANALYSIS
The aim of this investigation is to identify differences in disability prevalence measures across each collection in order to understand who is being identified as having disability, and the implications this has on how data from each collection should be used.
The focus of this analysis will be on comparisons between severity of disability measures collected in the 2015 SDAC and measures derived from the Short Disability Module (SDM) (included in the 2012-13 NATSIHS and 2014-15 NATSISS). ‘Need for Assistance’ data, collected in the 2016 Census, will be included in the profound/severe discussions as this collection only provides data about this composite group. A comparison will also be made of Disability Group measures from the 2015 SDAC, 2012-13 NATSIHS and 2014-15 NATSISS.
In order to present the most comparable statistics from each collection, the following specifications have been set:
- Non-private dwellings have been excluded from all analyses.
- All data is limited to persons aged 15 years and over (the 15 years and over age range is common to all of the collections).
- Analyses have been presented separately for non-remote and remote/very remote areas, to allow for differences in the geographic scope of each survey.
- Most analyses have been presented by ten year age groups, as disability is strongly related to age.
For the purpose of this analysis, the term ‘Short Disability Module’ (SDM) is used as a cover phrase for both the 2012-13 NATSIHS and the 2014-15 NATSISS, even though there are some differences between the modules. Where these differences have an effect on the data, the differences are noted.
^
SEVERITY OF DISABILITY (NON-REMOTE)
The table below presents prevalence measures for severity of disability for the Aboriginal and Torres Strait Islander population. These measures, limited to non-remote data only, are from the following collections:
- 2015 Survey of Disability, Ageing and Carers (2015 SDAC)
- 2012-13 National Aboriginal and Torres Strait Islander Health Survey (2012-13 NATSIHS)
- 2014-15 National Aboriginal and Torres Strait Islander Social Survey (2014-15 NATSISS)
- 2016 Census
| Disability severity by survey, Aboriginal and Torres Strait Islander People aged 15 years and over, non-remote (a) |
|
 | 2015 SDAC | 2012-13 NATSIHS | 2014-15 NATSISS | 2016 Census |
 | % ± MoE of % |
|
| Total with disability | 29.4 ± 3.0 | 45.6 ± 2.4(b) | 45.4 ± 2.6(c) | na |
 | Specific limitation or restriction | 25.6 ± 3.2 | 30.1 ± 2.2(b) | 30.4 ± 2.3(c) | na |
 |  | Total core activity limitation | 21.9 ± 3.2 | 22.7 ± 2.0 | 24.1 ± 1.9 | na |
 |  |  | Profound/Severe | 7.2 ± 1.9 | 7.7 ± 1.3 | 7.8 ± 1.1 | 8.5(d) |
 |  |  |  | Profound | 2.1 ± 0.9 | 2.6 ± 0.7 | 2.7 ± 0.7 | na |
 |  |  |  | Severe | 5.3 ± 1.6 | 5.0 ± 1.0 | 5.1 ± 0.9 | na |
 |  |  | Moderate/Mild | 14.0 ± 2.6 | 14.9 ± 1.4 | 16.4 ± 1.6 | na |
 |  |  |  | Moderate | 4.8 ± 1.7 | 5.5 ± 0.8 | 6.8 ± 1.1 | na |
 |  |  |  | Mild | 9.1 ± 2.1 | 9.5 ± 1.3 | 9.7 ± 1.2 | na |
 |  |  | Education/employment restriction only | 4.4 ± 1.7 | 7.5 ± 1.3(b) | 6.2 ± 1.2 | na |
| No specific limitation or restriction | 3.5 ± 1.3 | 15.6 ± 1.7(b) | 14.9 ± 1.7(c) | na |
|
na not available
(a) Living in private households
(b) Difference between 2015 SDAC and 2012-13 NATSIHS data is statistically significant
(c) Difference between 2015 SDAC and 2014-15 NATSISS data is statistically significant
(d) Proportion based on total which includes 'not stated'
Examination of the table indicates that:
- Surveys using the SDM show significantly higher ‘Total with Disability’ prevalence rates than the SDAC.
- The difference in ‘Total with Disability’ rates is largely driven by higher rates of ‘no specific limitation or restriction’ data in the SDM, compared to the SDAC.
- Rates for ‘Specific limitation or restriction’ are significantly higher for the SDM compared to the SDAC. This appears to be driven by higher rates of ‘Education/Employment restriction only’ in the SDM compared with the SDAC.
- There is no statistically significant difference in the data between the SDM and SDAC for ‘Total Core activity limitations’ or any of the disaggregated items within this subtotal.
To understand these observations, it is useful to separately examine each of the disability severity measures.
^
TOTAL WITH DISABILITY (NON-REMOTE)
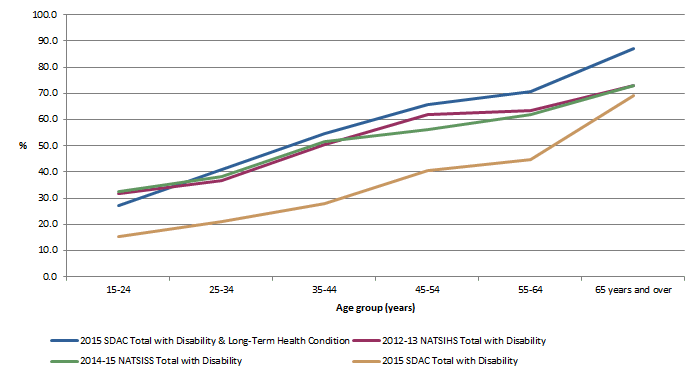
Prevalence rates for ‘Total with Disability’ by age group are shown in the graph below. In order to assist discussion of the differences in total disability prevalence rates across the survey collections, the combined measure of persons who have ‘Disability or non-limiting long-term health condition’ from the 2015 SDAC (49.4% ± 1.5%) has been included.
Prevalence of ‘total with disability’ by Age group for selected surveys, Non-remote (a)
(a) Aboriginal and Torres Strait Islander people aged 15 years and over, living in private households
Examination of the graph indicates that:
- The 2012-13 NATSIHS and 2014-15 NATSISS SDM measures of ‘total with disability’ are significantly higher across almost all age groups, compared with the 2015 SDAC measure of ‘total with disability’.
- Differences between rates across all age groups are statistically significant except for those aged 65 years and over.
^
- The 2012-13 NATSIHS and 2014-15 NATSISS SDM measures of ‘total with disability’ are closely aligned to the 2015 SDAC combined measure of ‘disability or long-term health condition’.
- There are no statistically significant differences across all age groups except for those aged 65 years and over.
^
- The close alignment of 2012-13 NATSIHS and 2014-15 NATSISS ‘total with disability’ measures to the 2015 SDAC combined measure of ‘disability or long-term health condition’ indicates that the SDM ‘total with Disability’ measure includes respondents with long-term health condition(s) that are not defined in the SDAC as restricting respondents in their everyday activities.
Discussion
Analysis of the above graph shows that there is a difference between how long-term health conditions are defined as restrictive or non-restrictive in the SDAC compared with the SDM. The SDAC uses a large number of screening questions designed to collect a precise measure of disability, differentiating between those who have long-term health conditions only, and those whose long-term health conditions limit their activities (i.e. have disability).
The SDM uses a much smaller number of questions to define disability and as such, the filters used to differentiate between those with a restrictive long-term health condition and those with a non-restrictive long-term health condition operate differently to the SDAC.
The differences between how restrictive long-term health conditions are defined in the SDAC compared with the SDM, demonstrates why the ‘total with disability’ measures from the NATSIHS and NATSISS should not be used as a proxy for monitoring disability prevalence between SDAC collections. The additional detail collected in the SDAC allows for the most robust measure of disability prevalence across all population groups.
Caution
It is important to note that long-term health conditions data in the SDAC, and data derived from the SDM, should not be used as a proxy measure of long-term health conditions in the Aboriginal and Torres Strait Islander population. Accurate, detailed information on long-term health conditions in this population can be obtained from the National Aboriginal and Torres Strait Islander Health Survey using long-term health conditions data items.
^
SPECIFIC LIMITATION OR RESTRICTION (NON-REMOTE)
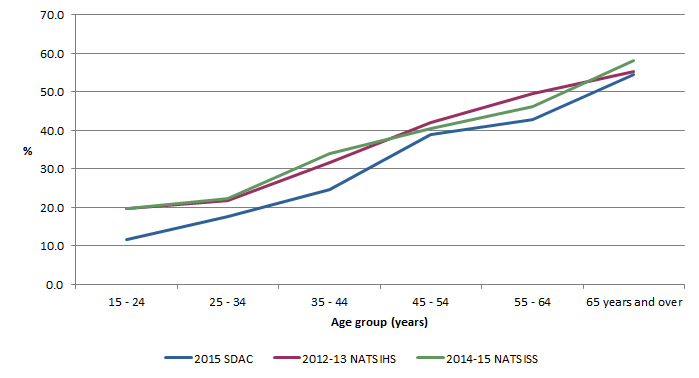
Prevalence of ‘specific limitation or restriction’ by Age group for selected surveys, Non-remote (a)
(a) Aboriginal and Torres Strait Islander people aged 15 years and over, living in private households
Examination of the graph indicates that:
- Measures of ‘specific limitation or restriction’ from the SDAC and the SDM are in reasonable agreement.
- There are no statistically significant differences between age groups except for the 15-24 year age group, which are statistically significantly higher for the NATSIHS and NATSISS compared with the SDAC.
^
- Significant differences for the 15-24 year age group between the SDAC and SDM, appear to be driven by differences in the ‘schooling or employment restriction’ category for this age group (see the ‘schooling or employment restriction’ analysis for further discussion).
Discussion
In the SDAC, the sequence of survey questions first determines whether there are people in a household who have conditions which have lasted or are likely to last for at least 6 months. These people are then personally interviewed to determine whether their conditions cause them restrictions in their everyday lives. If they are found to have restricting conditions, they are identified as having disability. They are then asked to identify the level of restriction caused by this disability. If they are found to have a core activity restriction or limitation (i.e. a limitation in their ability to look after themselves, move around freely and communicate with others) or if they are found to have a restriction that affects their schooling or employment capability, they are said to have a ‘specific restriction’. All other people with disabilities who do not have a specific restriction are said to have ‘no specific restriction or limitation’.
A similar process is followed with the SDM, resulting in similar outcomes across the collections.
^
CORE ACTIVITY LIMITATIONS (NON-REMOTE)
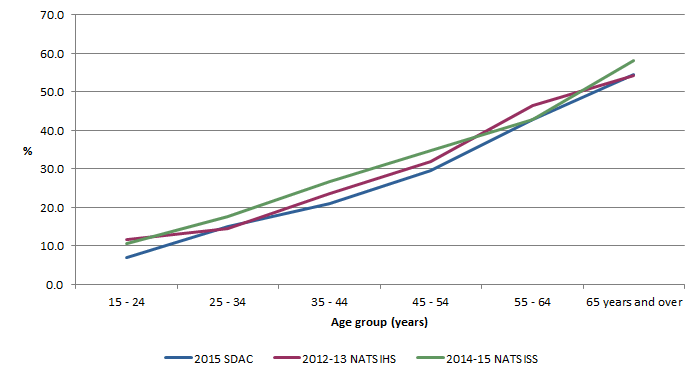
Prevalence of ‘core activity limitation’ by Age group for selected surveys, Non-remote (a)
(a) Aboriginal and Torres Strait Islander people aged 15 years and over, living in private households
Examination of the graph indicates that:
- Measures for ‘core activity limitation’ correspond well between the SDAC and the SDM, and there are no statistically significant differences between survey collections.
Discussion
The 'core activity limitation' category includes all people defined as having profound, severe, moderate or mild disability. The different disability severity levels indicate the level of limitation a person is experiencing in one of the core areas of self-care, mobility or communication.
In the SDAC the disability severity levels that make up the total ‘core activity limitation’ measures are defined as:
- ‘Profound’ - means a person always needs help with core activities;
- ‘Severe’- means a person sometimes needs help with core activities;
- ‘Moderate’ – means a person may have difficulties in at least one core activity, but needs no help in performing the activity; and
- ‘Mild’ – means the person needs no help and has no difficulty with core activities, but they use aids and/or can’t easily do certain tasks such as:
- walking 200 metres;
- negotiating stairs;
- bending to pick up objects; or
- using public transport.
^
The SDM uses similar definitions to the SDAC for measuring core-activity limitations. Note that in the 2012-13 NATSIHS, questions related to ‘mild core-activity limitations’ were only asked in non-remote areas.
^
PROFOUND/SEVERE CORE ACTIVITY LIMITATION (NON-REMOTE)
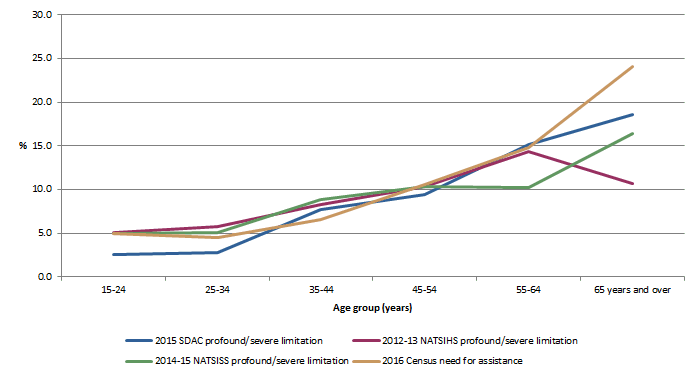
Prevalence of Profound/severe core activity limitation by Age group for selected surveys, Non-remote (a)
(a) Aboriginal and Torres Strait Islander people aged 15 years and over, living in private households
Examination of the graph indicates that:
- Measures of ‘profound/severe core activity limitation’ are reasonably consistent between collections across all age groups until 55 years and over, when the data becomes more varied.
- The sample for the 2015 SDAC is much smaller than other collections in this graph. As a result the associated levels of uncertainty for the 2015 SDAC measures are very high. This means that, although there appears to be some difference between 2015 SDAC measures and other collections, there are no statistically significant differences across all age groups when comparing this survey.
- The 55-64 year age group for NATSISS and the 65+ age groups for both NATSISS and NATSIHS are statistically significantly lower than the relative Census measures.
Discussion
The combination of profound and severe core activity limitations is a measure commonly used because it represents the population with the greatest disability and therefore the greatest need for assistance with core activities. The measure of profound/severe is conceptually comparable between the SDAC, the SDM and the 2016 Census ‘Has need for assistance with core activities’.
Both the SDAC and the SDM collect data on the full range of disability severity (profound, severe, moderate and mild). The Census, however, uses only four questions that specifically target those with a need for assistance in one or more core activity areas. The small number of questions in the Census means there are fewer opportunities for people to be identified and correctly categorised into severity of limitation groups. This may result in smaller than expected populations.
Another factor to consider when analysing the Census ‘Need for Assistance’ data is the way in which the information is collected. Personal interviews tend to elicit higher response rates than self-completed paper or on-line questionnaires. Also, the greater the number of people interviewed, the higher the chance of identifying people who need assistance.
Caution
It is important to consider the Census net undercount for the Aboriginal and Torres Strait Islander population (estimated to be 138,000 people), and the potential impact this has on the quality of ‘Need for Assistance’ data for this population.
^
PROFOUND/SEVERE CORE ACTIVITY LIMITATION (REMOTE/VERY REMOTE)
Prevalence of Profound/severe core activity limitation by Age group for selected surveys, Remote/Very Remote (a)
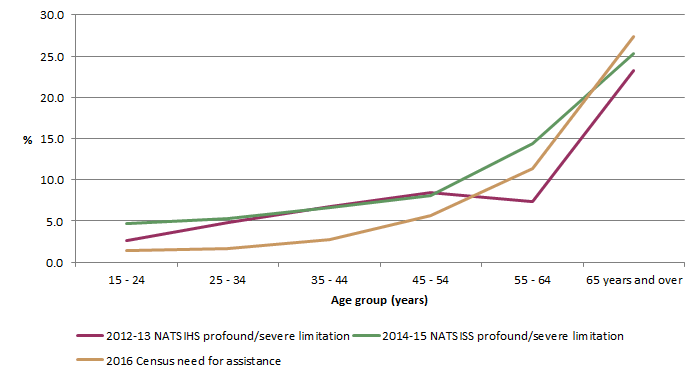
(a) Aboriginal and Torres Strait Islander people aged 15 years and over, living in private households
Examination of the graph indicates that:
- Profound/severe measures from the 2016 Census consistently sit lower than the 2012-13 NATSIHS and 2014-15 NATSISS, until the 55-64 years age group. The significance of these differences varies across age groups.
- Profound/severe measures from the NATSIHS are statistically significantly higher than the Census for the 25-34 years age group.
- Profound/severe measures from the NATSISS are statistically significantly higher than the Census for age groups 15-24 and 35-44.
- There are no statistically significant differences between the NATSIHS and NATSISS measures.
- Population samples for the 2012-13 NATSIHS and 2014-15 NATSISS are relatively small for profound/severe measures in remote/very remote areas. As such, the associated levels of uncertainty for data in some age groups are quite high and the data from these surveys should be considered with caution.
Discussion
Although the 2012-13 NATSIHS and 2014-15 NATSISS both collected a range of ‘Severity of Disability’ measures in remote/very remote areas, only the combined measure of profound/severe core activity limitation is considered in this analysis. This is due to the 2016 Census being the only other comparative collection for remote/very remote areas, with the Census ‘Need for Assistance’ measure being conceptually comparable to the ‘profound/severe core activity limitation’ category. There is no data available from the 2015 SDAC as this survey does not collect information from very remote areas.
Caution
As noted in the non-remote analysis, it is important to consider the Census net under count for the Aboriginal and Torres Strait Islander population (estimated to be 138,000 people), and the potential impact this has on the quality of ‘Need for Assistance’ data for this population.
^
MODERATE CORE ACTIVITY LIMITATION (NON-REMOTE)
Prevalence of Moderate core activity limitation by Age group for selected surveys, Non-remote (a)
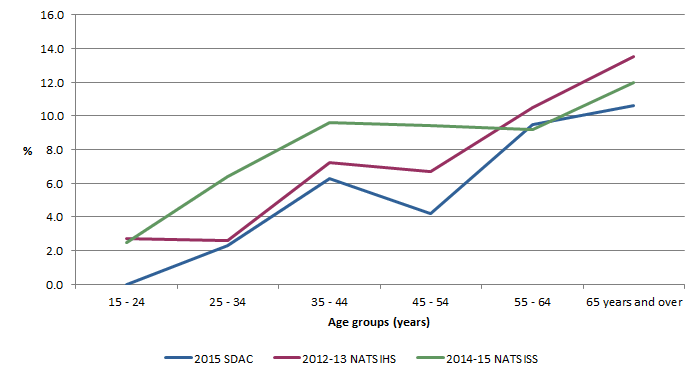
(a) Aboriginal and Torres Strait Islander people aged 15 years and over, living in private households
Examination of the graph indicates that:
- For all survey collections, there is a linear rise in rates for ‘moderate core activity’ as age increases.
- The 2015 SDAC ‘moderate limitation’ sample is very small and the associated levels of uncertainty for this measure are very high, as such this data should be considered with caution.
- Associated levels of uncertainty for some age groups in the NATSIHS and NATSISS are also quite high.
- There is little significant difference between age groups.
- Moderate limitation measures from the NATSIHS and NATSISS are statistically significantly higher than the SDAC for the 15-24 year age group.
- Moderate limitation measures from the NATSIHS are statistically significantly lower than the NATSISS for the 15-24 year age group.
Discussion
In both the SDAC and SDM a person is defined as having a ‘Moderate core activity limitation’ if they have difficulty with at least one of the core activities, but do not require assistance to be able to manage by themselves.
^
MILD CORE ACTIVITY LIMITATIONS (NON-REMOTE)
Prevalence of Mild core activity limitation by Age group for selected surveys, Non-remote (a)
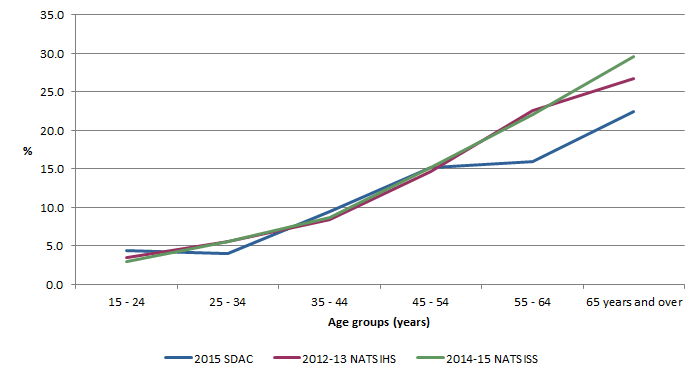
(a) Aboriginal and Torres Strait Islander people aged 15 years and over, living in private households
Examination of the graph indicates that:
- Measures for ‘mild core activity limitation’ derived from the SDM relate well to the corresponding 2015 SDAC estimates, with no statistically significant difference between collections.
- It is important to note that the sample counts in the 2015 SDAC for Aboriginal and Torres Strait Islander people are again quite small compared to the 2012-13 NATSIHS and 2014-15 NATSISS, with a high level of uncertainty for some age groups.
Discussion
A person is defined in both the SDAC and the SDM as having a 'mild core activity limitation' if they do not need help and have no difficulty with core activities, but they use aids and/or cannot easily do certain tasks such as walking 200m, negotiating stairs, bending to pick up objects or using public transport. The general alignment of results in measuring mild core activity limitation across age groups in the SDAC and surveys using the SDM is also seen when comparing results for the broader Australian population (see 4431.0.55.002 – ABS Sources of Disability Information, 2012-2016).
^
EDUCATION/EMPLOYMENT RESTRICTION ONLY (NON-REMOTE)
People are classified as having an ‘education or employment restriction only’ if they have a restriction that does not impact on their communication, self-care or any aspect of their mobility, but does impact on their ability to study, attend an educational institution, or the nature of the work they can do.
Prevalence of Education or Employment limitation by Age group for selected surveys, Non-remote (a)
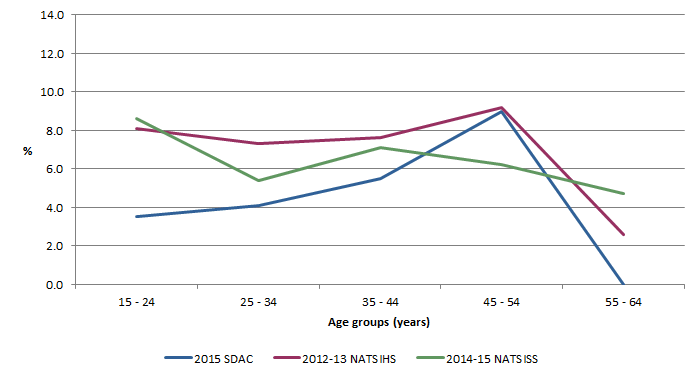
(a) Aboriginal and Torres Strait Islander people aged 15 years and over, living in private households
Examination of the graph indicates that:
- 'Education/ employment restriction only' measures in the 2012-13 NATSIHS and 2014-15 NATSISS correspond well to each other, with no statistically significant difference between the surveys.
- 2015 SDAC estimates for the 15-24 and the 55-64 year age groups are statistically significantly lower when compared to those from the SDM. All other age groups correspond well across the surveys.
- 2015 SDAC measures, across all age groups, have very high levels of uncertainty and need to be considered with caution when comparing with other survey data.
Discussion
Although the SDAC and SDM define education or employment restriction in the same way, it is important to consider that the condensed format and the use of prompt cards in the SDM, may elicit a higher proportion of positive responses than corresponding SDAC questions. In the SDAC, the questions about education and employment restrictions follow a substantial number of questions about a person’s need and receipt of assistance with activities of daily living. These detailed questions provide a different frame of reference in answering the questions about educational and employment restrictions to those people completing the SDM and may therefore lead to different answers being supplied in some cases.
^
NO SPECIFIC LIMITATION OR RESTRICTION (NON-REMOTE)
Prevalence of No specific limitation or restriction by Age group for selected surveys, Non-remote (a)
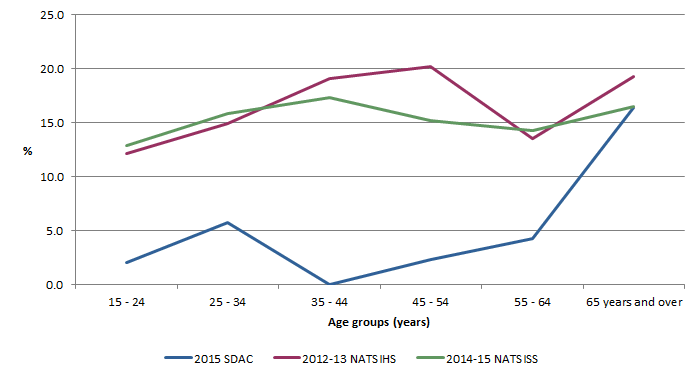
(a) Aboriginal and Torres Strait Islander people aged 15 years and over, living in private households
Examination of the graph indicates that:
- Measures of ‘no specific limitation or restriction’ in the SDM are significantly higher than measures collected in the 2015 SDAC.
- SDM ‘no specific limitation or restriction’ measures are statistically significantly higher than those in the 2015 SDAC for all ages, except the 65+ age group.
- There is no statistically significant difference between the 2012 NATSIHS and the 2014-15 NATSISS.
- Measures for the 2015 SDAC ‘no specific limitation or restriction’ have very high levels of uncertainty and the data needs be considered with caution.
Discussion
The largest difference between disability severity measures collected in the 2015 SDAC and those collected using the SDM occurs in this category. As discussed in the analysis of ‘total with Disability’, it appears that the ‘no specific limitation or restriction’ category for surveys using the SDM include respondents with a non-restrictive long-term health condition, as defined by the SDAC.
This difference is also observed when the performance of the SDM is compared with the SDAC for the general Australian population, with SDM measures for the ‘no specific limitation or restriction’ category being between 3 to 5 times higher than the SDAC (see 4431.0.55.002 – ABS Sources of Disability Information, 2012-2016).
^
DISABILITY GROUPS (NON-REMOTE)
In order to better understand differences between disability severity measures identified by the 2015 SDAC, and those identified using the SDM, we have included a comparative analysis below of ‘Disability Group’ data. This analysis gives a detailed picture of what types of limitations or restrictions are contributing to the differences in disability measures across surveys.
Disability Groups for selected surveys, Non-remote (a)
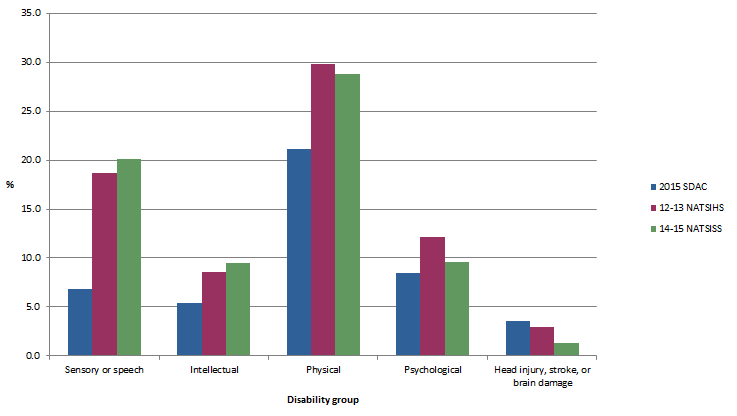
(a) Aboriginal and Torres Strait Islander people aged 15 years and over, living in private households
Examination of the graph indicates that:
- The proportion of people reporting a sensory or speech, intellectual or physical impairment is statistically significantly higher in the SDM when compared with the 2015 SDAC.
- When analysed across age groups, higher rates of sensory or speech and physical impairments in the SDM appear to be fairly consistent across the lifespan.
- When analysed across age groups, higher rates of intellectual impairments in the SDM appear to be in the younger 15-24 year age group.
- Note that, 2015 SDAC intellectual impairment measures across age groups have very high levels of uncertainty and comparisons between measures need to be considered with caution.
- There is no clear pattern of difference between the 2015 SDAC and SDM measures for those with head injury, stroke or brain damage or psychological restriction.
- The Disability Group ‘other/type not specified’ has not been included in this table as definition of this measure is not considered to be comparable between the SDAC and SDM.
It should be noted there is another category for ‘disability group’, which is labelled ‘other’ in the SDAC and ‘type not specified’ in the SDM. These groups are collected in a different manner in the two surveys and the results are not comparable, leading to their exclusion from this analysis.
Discussion
The greatest difference between the 2015 SDAC and the SDM occurs for those reporting a sensory or speech impairment. This may be due to the SDAC asking more questions about a person’s hearing impairment than the SDM. The SDAC not only establishes whether a person has hearing loss, but also ascertains whether the person is impaired by their hearing loss. This may have the effect of reducing the number of people with hearing loss being counted as having a hearing impairment in the SDAC.
The reason for the difference in intellectual and physical impairments is less certain and may be related to a combination of different survey methodology used to collect the information and high levels of uncertainty associated with Aboriginal and Torres Strait Islander data in the SDAC.
It is worth noting the difference in the identification of people with Sensory and speech and physical impairments has also been observed when comparing results from the SDM and the SDAC for the general Australian population, with SDM measures around 5 to 9 percentage points higher than the SDAC for sensory and speech, and 5 to 11 percentage points higher for physical impairments (see 4431.0.55.002 – ABS Sources of Disability Information, 2012-2016).
 Print Page
 Print All