GOVERNMENT ADMINISTRATION AND DEFENCE
Definition and scope
The Government administration and defence industry includes central, state and local government units mainly engaged in government administration and regulatory activities, as well as judicial authorities and commissions, representatives of overseas governments, and the Army, Navy and Air defence forces and civilian units mainly engaged in defence administration.
ANZSIC Division M, Government administration and defence, consists of two sub-divisions:
- Government administration (sub-division 81)
- Defence (sub-division 82).
Summary of GSP(P) sources and methods
The methodology for Government administration and defence uses an input indicator approach to compile state by industry GVA estimates. Volume input indicators are derived as the sum of hours worked for both Government administration employees and Defence employees by state.
The state specific input indicators are derived by taking numbers of Government administration and defence employees by state and multiplying them by the average hours worked for Government administration and Defence employees by state. The resultant hours worked by state for Government administration and Defence employees are summed to form total division level hours worked by state.
The data on average hours worked in Government administration and defence by state is from the ABS Labour Force, Australia. The number of Government administration employees is from the ABS Wage and Salary Earners, Public Sector, Australia (cat. no. 6248.0.55.001). The state ratio of defence force employees (from the Department of Defence annual report) is used to allocate the total number of Defence employees to state.
The state input volume indicators are used to derive volume measures of GVA for Government administration and defence. The state volume GVAs are benchmarked to the annual national industry volume GVA.
Results for Government administration and defence
Government administration and finance gross value added(a), Chain volume measures(b) |
|  |
 | 2000-01 | 2001-02 | 2002-03 | 2003-04 | 2004-05 | 2005-06 |  |
Values ($m) |  |
|  |
| New South Wales | 10 459 | 11 297 | 10 852 | 10 502 | 10 586 | 11 017 |  |
| Victoria | 5 071 | 5 586 | 5 536 | 5 544 | 5 468 | 5 403 |  |
| Queensland | 6 352 | 6 584 | 6 150 | 6 380 | 6 884 | 7 402 |  |
| South Australia | 1 641 | 1 778 | 1 747 | 1 907 | 2 032 | 2 038 |  |
| Western Australia | 2 211 | 2 045 | 2 036 | 2 291 | 2 445 | 2 387 |  |
| Tasmania | 762 | 807 | 934 | 865 | 905 | 896 |  |
| Northern Territory | 759 | 691 | 738 | 819 | 869 | 827 |  |
| Australian Capital Territory | 4 680 | 4 544 | 4 848 | 4 951 | 5 206 | 5 226 |  |
| Australia | 31 726 | 33 087 | 32 691 | 33 217 | 34 394 | 35 195 |  |
Percentage changes from previous year (%) |  |
|  |
| New South Wales | -1.9 | 8.0 | -3.9 | -3.2 | 0.8 | 4.1 |  |
| Victoria | 9.3 | 10.2 | -0.9 | 0.1 | -1.4 | -1.2 |  |
| Queensland | 3.5 | 3.7 | -6.6 | 3.7 | 7.9 | 7.5 |  |
| South Australia | 3.6 | 8.4 | -1.7 | 9.2 | 6.5 | 0.3 |  |
| Western Australia | 5.4 | -7.5 | -0.4 | 12.5 | 6.7 | -2.4 |  |
| Tasmania | -4.7 | 5.9 | 15.8 | -7.5 | 4.6 | -1.0 |  |
| Northern Territory | -9.4 | -9.0 | 6.8 | 11.1 | 6.1 | -4.8 |  |
| Australian Capital Territory | 3.0 | -2.9 | 6.7 | 2.1 | 5.2 | 0.4 |  |
| Australia | 2.3 | 4.3 | -1.2 | 1.6 | 3.5 | 2.3 |  |
|  |
| (a) At basic prices. |
| (b) Reference year for chain volume measures is 2004-05. |
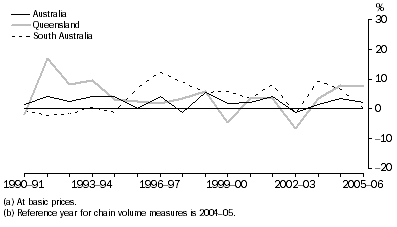
Government administration and defence gross value added(a), Chain volume measures(b)-Percentage changes

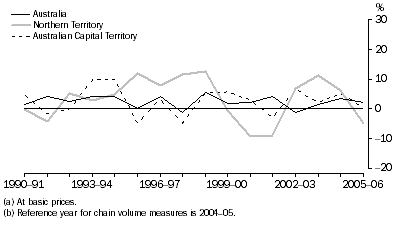
Government administration and defence gross value added(a), Chain volume measures(b)-Percentage changes

Government administration and defence gross value added(a), Chain volume measures(b)-Percentage changes

Government administration and defence gross value added(a), Chain volume measures(b)-Percentage changes

In 2005-06, New South Wales, Queensland, South Australia and the Australian Capital Territory all had positive growth, with highest growth being recorded by Queensland at 7.5%.
Government administration and defence gross value added, State shares - Current prices |
|  |
 | 1989-90 | 1994-95 | 1999-00 | 2003-04 | 2004-05 | 2005-06 |  |
 | % | % | % | % | % | % |  |
|  |
| New South Wales | 29.5 | 29.0 | 31.2 | 30.1 | 30.8 | 30.9 |  |
| Victoria | 23.8 | 21.3 | 16.8 | 16.2 | 15.9 | 15.6 |  |
| Queensland | 13.4 | 16.9 | 18.0 | 20.5 | 20.0 | 20.5 |  |
| South Australia | 6.9 | 5.7 | 6.3 | 5.9 | 5.9 | 5.8 |  |
| Western Australia | 7.3 | 7.5 | 7.3 | 6.9 | 7.1 | 7.3 |  |
| Tasmania | 2.6 | 2.5 | 2.5 | 2.6 | 2.6 | 2.6 |  |
| Northern Territory | 2.2 | 2.0 | 2.7 | 2.5 | 2.5 | 2.5 |  |
| Australian Capital Territory | 14.4 | 15.1 | 15.2 | 15.3 | 15.1 | 14.7 |  |
| Australia | 100.0 | 100.0 | 100.0 | 100.0 | 100.0 | 100.0 |  |
|  |
The Australian Capital Territory has a large share (14.7% in 2005-06) of GVA for this industry relative to its population. This is due to the high proportion of Commonwealth government activities in the Australian Capital Territory. Victoria and Queensland experienced a change in their shares throughout the time series. Victoria's share decreased from 23.8% in 1989-90 to 15.6% in 2005-06 while Queensland has increased its share from 13.4% in 1989-90 to 20.5% in 2005-06.
 Print Page
 Print All