|
|
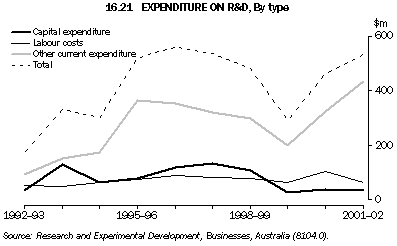
The mining industry has been spending increasing amounts of R&D expenditure. Over the period 1992-93 to 2001-02, expenditure has increased by 203% from $176m in 1992-93 to $534m in 2001-02. At the end of this period, mining accounted for 9.6% of total R&D expenditure by all industries in comparison to 6.2% in 1992-93. The manufacturing industry's share of total R&D expenditure continued to be the highest, accounting for 43% in 2001-02.
Graph 16.21 shows the type of R&D expenditure by the mining industry. For the period 1992-93 to 2001-02, current expenditure other than labour costs is the major component of R&D expenditure for the mining industry, accounting for 82% of mining R&D expenditure in 2001-02. This category includes expenses on materials, fuels, rent and hiring, repairs and maintenance and data processing etc. and the proportion of expenses on general services and overheads attributable to R&D activity. In the mining industry, these expenses increased by $343m (373%) from $92m in 1992-93 to $435m in 2001-02, while the amount spent on labour and capital fell. As a result, labour cost and capital expenditure as a proportion of total R&D expenditure fell to 12% and 6.4% respectively in 2001-02. For all industries, other current expenditure of $2,737m accounted for 49% of total expenditure ($5,546m) in 2001-02, while labour costs contributed 43% ($2,398m) and capital expenditure 7.4% ($410m).

16.22 EXPENDITURE ON R&D, By selected locations(a)
|
 | 1997-98 |  | 1998-99 |  | 1999-2000 |  | 2000-01 |  | 2001-02 |
 |
|  |
|  |
|  |
|  |
|
 | Mining | All
industries |  | Mining | All
industries |  | Mining | All
industries |  | Mining | All
industries |  | Mining | All
industries |
 | '000 | '000 |  | '000 | '000 |  | '000 | '000 |  | '000 | '000 |  | '000 | '000 |
|
| NSW | 115,489 | 1,432,711 |  | 91,349 | 1,391,692 |  | 37,265 | 1,440,297 |  | 57,095 | 1,737,401 |  | 84,623 | 2,070,607 |
| Vic. | 32,067 | 1,444,499 |  | 37,940 | 1,445,212 |  | 36,964 | 1,495,106 |  | 31,499 | 1,718,379 |  | 36,176 | 1,792,740 |
| Qld | 123,149 | 486,278 |  | 71,736 | 437,246 |  | 72,642 | 441,523 |  | 116,628 | 523,953 |  | 216,613 | 722,889 |
| SA | n.p. | 241,429 |  | 35,072 | 248,516 |  | 20,559 | 247,342 |  | 25,452 | 295,175 |  | n.p. | 364,216 |
| WA | 195,735 | 465,544 |  | 214,932 | 440,177 |  | 102,699 | 336,538 |  | 213,426 | 479,043 |  | 122,570 | 403,628 |
| Other(b) | 30,375 | 122,495 |  | 22,368 | 89,341 |  | 17,260 | 110,832 |  | 14,135 | 99,619 |  | 25,206 | 115,044 |
| Overseas | n.p. | 28,105 |  | 11,345 | 42,517 |  | 3,882 | 40,722 |  | 4,188 | 63,788 |  | n.p. | 76,411 |
| Total | 536,646 | 4,221,061 |  | 484,742 | 4,094,701 |  | 291,271 | 4,112,360 |  | 462,423 | 4,917,357 |  | 533,948 | 5,545,534 |
|
(a) Excludes businesses in Agriculture, forestry and fishing (i.e. in ANZSIC Division A).
(b) Other states and territories. |
 |  |  |  |  |  |  |  |  |  |  |  |  |  |  |
| Source: Research and Experimental Development, Businesses, Australia (8104.0). |
In 2001-02, the mining industry funded most of its R&D expenditure with $520m (97%) sourced from money owned by the mining business (own funds). The remaining expenditure is funded from the Australian Government and businesses in other industries. This compares with the total for all industries of which $4,782m (86%) was sourced from own funds, $268m (4.8%) from the Australian Government, $309m (5.6%) from overseas, $136m (2.5%) from other businesses, and the remainder from state and local government and other Australian (including higher education and private non-profit sectors) sources.
|
 Print Page