|
|
SUMMARY OF FINDINGS
- There were 2,141,280 actively trading businesses in Australia at June 2012. This was an increase of 8,868 (0.4%) businesses from 2011.
- For the 2011–12 financial year, the entry rate (13.5%) of businesses was higher than the exit rate (13.1%) resulting in an increase in the number of overall businesses.
- The entry rate of businesses decreased by 0.4 percentage points from 13.9% to 13.5% for the 2011–12 financial year. This was after a decrease of 2.8 percentage points (–48,543) in the 2010–11 financial year.
- The exit rate of businesses decreased by 0.4 percentage points from 13.5% to 13.1% for the 2011–12 financial year. This was after an increase of 0.4 percentage points for 2010–11 financial year.
- In terms of business survival rates, of the 2,071,360 businesses operating in June 2008, 84.6% were still operating in June 2009, 75.1% were still operating in June 2010, 67.9% were still operating in June 2011 and 61.8% were still operating in June 2012.
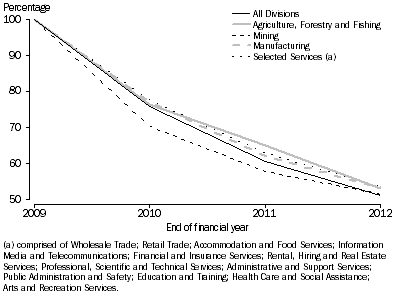
- Of the 299,123 new business entries during 2008–09, 75.8% were still operating in June 2010, 60.5% were still operating in June 2011 and 51.0% were still operating in June 2012.
INDUSTRY
- At June 2012, the 'Construction' industry had the highest number of businesses operating in Australia (347,197). This was followed by the 'Professional, Scientific and Technical Services' (251,098) and 'Rental, Hiring and Real Estate Services' (225,013) industries.
- At June 2012, the 'Electricity, Gas, Water and Waste Services' industry had the lowest number of businesses operating in Australia (5,833). This was followed by the 'Public Administration and Safety' (7,663) and 'Mining' (8,438) industries.
- During the 2011–12 financial year, the 'Accommodation and Food Services' and 'Administrative and Support Services' industries had the highest entry rates of 16.7% and 16.4% respectively.
- 'Agriculture, Forestry and Fishing' and 'Rental, Hiring and Real Estate Services' industries had the lowest entry rates of 6.5% and 8.8% respectively in 2011–12.
- During the 2011–12 financial year, the 'Public Administration and Safety' and 'Administrative and Support Services' industries had the highest exit rates of 17.5% and 16.8% respectively.
- 'Health Care and Social Assistance' and 'Agriculture, Forestry and Fishing' industries had the lowest exit rates of 8.1% and 9.4% respectively in the 2011–12 financial year.
- The survival rates at June 2012 for businesses operating in June 2008 were highest for 'Health Care and Social Assistance' (73.1%) and 'Agriculture, Forestry and Fishing' (70.7%), followed by 'Rental, Hiring and Real Estate Services' (69.4%).
- The survival rates at June 2012 for businesses operating in June 2008 were lowest for 'Public Administration and Safety' (50.9%), 'Accommodation and Food Services' (53.6%), followed by 'Administrative and Support Services' (54.3%).
Survival of Entries by ANZSIC Industry Division, as a % of business entries during financial year 2008–09
MAIN STATE OF OPERATION
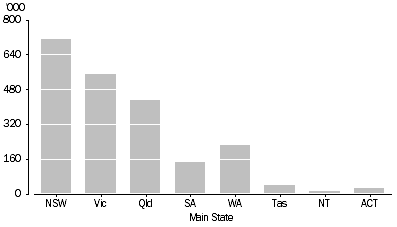
- The state with the highest number of businesses operating in 2011–12 was New South Wales (710,733). This was followed by Victoria (551,220), Queensland (428,515), Western Australia (221,918), South Australia (148,138), Tasmania (38,658), the Australian Capital Territory (26,016) and the Northern Territory (14,669).
- The largest increase in businesses for a single state was in Victoria (7,291). This was followed by New South Wales (3,849).
- The largest decrease in businesses for a single state was in Queensland (–2,032). This was followed by Western Australia (–771).
- The highest entry rate for a single state was in the Australian Capital Territory (15.7%). This was followed by the Northern Territory (15.0%).
- The highest exit rate for a single state was in the Australian Capital Territory (14.1%). This was followed by Queensland (14.0%).
- Of the businesses operating in June 2008, the highest survival rate in June 2012 was seen in Tasmania (65.6%) and South Australia (64.7%). The lowest survival rates was seen in the Australian Capital Territory (59.0%).
Business count by main state, operating at end of financial year 2011–12
INSTITUTIONAL SECTOR
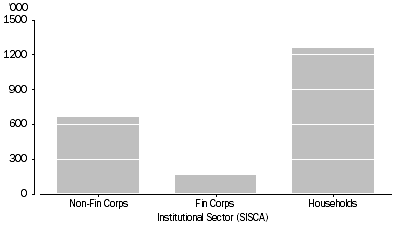
- Of the 2,141,280 businesses operating in 2012, the largest contributor was 'Households' (1,250,651) which includes most unincorporated businesses followed by 'Non–Financial Corporations' (659,866) and 'Financial Corporations' (162,427).
- The 'Non–Financial Corporations' sector and 'Financial Corporations' sector recorded positive growths of 2.0% and 1.7% respectively in 2011–12, whereas the 'Households' sector contracted by 2.6%.
- The 'Financial Corporations' sector had the largest entry rate at 13.0%. This was followed by 'Non–Financial Corporations' (12.6%) and 'Households' (11.5%).
- The 'Households' sector exhibited the largest exit rate of 14.1%. This was followed by 'Financial Corporations' (11.3%) and 'Non–Financial Corporations' (10.6%).
- The survival rates at June 2012 for businesses operating in June 2008 were highest for 'Non–Financial Corporations' (67.1%), followed by 'Financial Corporations' (63.9%), and 'Households' (59.9%).
- Of the businesses that entered during 2008–09, the highest survival rates in June 2012 was seen in the 'Financial Corporations' sector (60.3%), followed by 'Non–Financial Corporations' (55.7%) and 'Households' (49.0%).
Business counts by Institutional Sector, operating at the end of financial year 2011–12
TYPE OF LEGAL ORGANISATION
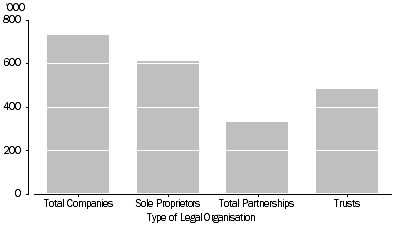
- At June 2012, there were 726,893 'Companies' in Australia, followed by 607,315 'Sole Proprietors', 478,955 'Trusts' and 327,519 'Partnerships'. There were a relatively small number of businesses operating in the 'Public Sector' (598).
- During the 2011–12 financial year, the entry rate was highest for 'Sole Proprietors' (16.2%), followed by 'Companies' (14.4%), 'Trusts' (12.6%), the 'Public Sector' (10.1%) and 'Partnerships' (8.0%).
- During the 2011–12 financial year, the exit rate was highest for 'Sole Proprietors' (18.6%) followed by 'Partnerships' (11.9%), 'Companies' (10.9%), the 'Public Sector' (9.9%) and 'Trusts' (9.8%).
- The survival rates at June 2012 for businesses operating in June 2008 were highest for 'Trusts' (69.4%), followed by 'Companies' (66.4%), 'Partnerships' (63.0%), the 'Public Sector' (62.6%) and 'Sole Proprietors' (51.3%).
Business counts by Type of Legal Organisation, operating at the end of financial year 2011–12 (Private Sector)
EMPLOYMENT SIZE RANGES
- At June 2012, there were 835,187 'Employing' businesses and 1,306,093 'Non–employing' businesses.
- There were 514,859 businesses that employed '1–4' employees, followed by 231,591 businesses that employed '5–19' employees, 82,326 businesses employing '20 –199' employees and 6,411 businesses that employed '200+' employees.
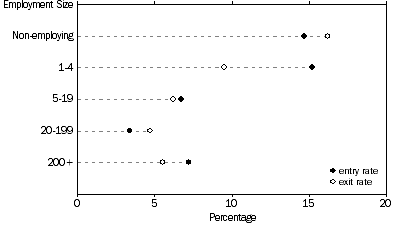
- For the 2011–12 financial year, the highest amount of entries were seen in the '1–4' employment size range (15.2%). This was followed by 'Non–employing' businesses (14.7%), the '200+' employment size range (7.2%), the '5–19' employment size range (6.7%) and the '20–199' employment size range (3.4%).
- The highest exit rate was in the 'Non–employing' businesses (16.2%), followed by the '1–4' employment size range (9.5%), the '5–19' employment size range (6.2%), the '200+' employment size range (5.5%) and the '20–199' employment size range (4.7%).
Entries and Exits by Employment Size Range, as a % of business counts at the start of financial year 2011–12
ANNUAL TURNOVER SIZE RANGES
- At June 2012, there were 597,930 businesses operating in the 'zero to less than $50k' turnover range, 739,869 businesses in the '$50k to less than $200k' turnover range, 673,065 businesses in the '$200k to less than $2m' turnover range and 130,416 businesses in the '$2m or more' turnover range.
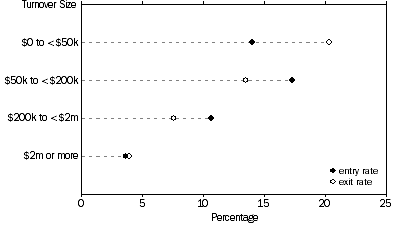
- During the 2011–12 financial year, entry rates were highest for businesses in the '$50k to less than $200k' (17.3%) turnover range, followed by businesses in the 'zero to less than $50k' turnover range (14.0%).
- Exit rates were highest for businesses in the 'zero to less than $50k' (20.3%) turnover range, followed by businesses in the '$50k to less than $200k' turnover range (13.5%) in 2011–12.
- In 2011–12, exit rates were lowest for businesses in the '$2m or more' turnover range (3.9%), followed by businesses in the '$200k to less than $2m' turnover range (7.6%).
Entries and Exits by Annual Turnover Size Range, as a % of business counts at the start of financial year 2011–12
|
 Quality Declaration
  Print Page
 Print All