AUSTRALIAN CAPITAL TERRITORY SUMMARY DATA
Policy makers now have access to better data on road freight movements to inform future road planning, thanks to a joint Federal and State funded report by Australian Bureau of Statistics (ABS). The report shows the first snapshot of road freight movements in 13 years. A snapshot of data for Australian Capital Territory is contained below in a data table and detailed map. More detailed information is available in Road Freight Movements, Australia (Cat. no 9223.0).
The following table contains estimates for the Australian Capital Territory and Australia for Tonnes Carried, Kilometres Travelled, Tonne-kilometres Travelled, Top 2 Commodities (Tonnes) by Vehicle Type by State of Origin and State of Destination and Intrastate. The table also includes estimates for Top Trailer Configuration and Most Common Method by Vehicle Type by Intrastate and Most Common Type of Goods by Vehicle Type by Dangerous and Refrigerated.
AUSTRALIAN CAPITAL TERRITORY SUMMARY DATA
 | Australian Capital Territory | Australian Capital Territory | Australian Capital Territory | Australia |  |
 | Rigid Trucks (million) | Articulated Trucks (million) | All Trucks (million) | All Trucks (million) | % of total |
|
Tonnes Carried |
| State of Origin | 9.7 | 1.2 | 10.8 | 2 131.7 | 0.5 |
| State of Destination | 11.2 | 2.5 | 13.7 | 2 131.7 | 0.6 |
| Intrastate | 9.1 | 0.5 | 9.6 | 2 131.7 | 0.5 |
|
Kilometres Travelled (Kms) |
| State of Origin | 89.5 | 28.6 | 118.1 | 17 213.4 | 0.7 |
| State of Destination | 91.7 | 29.3 | 121.0 | 17 213.4 | 0.7 |
| Intrastate | 57.0 | 1.9 | 58.9 | 17 213.4 | 0.3 |
|
Tonne-kilometres Travelled (T-kms) |
| State of Origin | 231.5 | 173.2 | 404.7 | 195 618.7 | 0.2 |
| State of Destination | 339.5 | 562.7 | 902.2 | 195 618.7 | 0.5 |
| Intrastate | 188.2 | 24.0 | 212.2 | 195 618.7 | 0.1 |
|
Top 2 Commodities (Tonnes) |
| State of Origin | 1 | Sand Stone and Gravel | Sand Stone and Gravel |  |
2.2 | 492.7 | 0.4 |
2 | Machinery and transport equipment | General Freight |  |
1.5 | 277.7 | n.a. |
 |
|
| State of Destination | 1 | Sand Stone and Gravel | Sand Stone and Gravel |  |
3.3 | 492.7 | 0.7 |
2 | General Freight | General Freight |  |
1.6 | 277.7 | 0.6 |
 |
|
| Intrastate | 1 | Sand Stone and Gravel | Sand Stone and Gravel |  |
2.0 | 492.7 | 0.4 |
2 | Machinery and transport equipment | General Freight |  |
1.4 | 277.7 | n.a. |
|
Top Trailer Configuration (T-kms) |
| Intrastate | No Trailer | B-Double | No Trailer | B-Double |  |
107.7 | 18.8 | 107.7 | 64 834.7 | n.a. |
|
Most Common Method (T-kms) |
| Intrastate | Other Freight | Other Freight | Other Freight | Other Freight |  |
122.2 | 24.0 | 146.2 | 115 618.4 | 0.1 |
|
Most Common Type of Goods (T-kms, Intrastate) |
| Dangerous | 1.4 | 0.0 | 1.4 | 11 058.3 | 0.0 |
| Refrigerated | 4.9 | 0.1 | 5.0 | 2 651.7 | 0.2 |
|
n.a. = not available
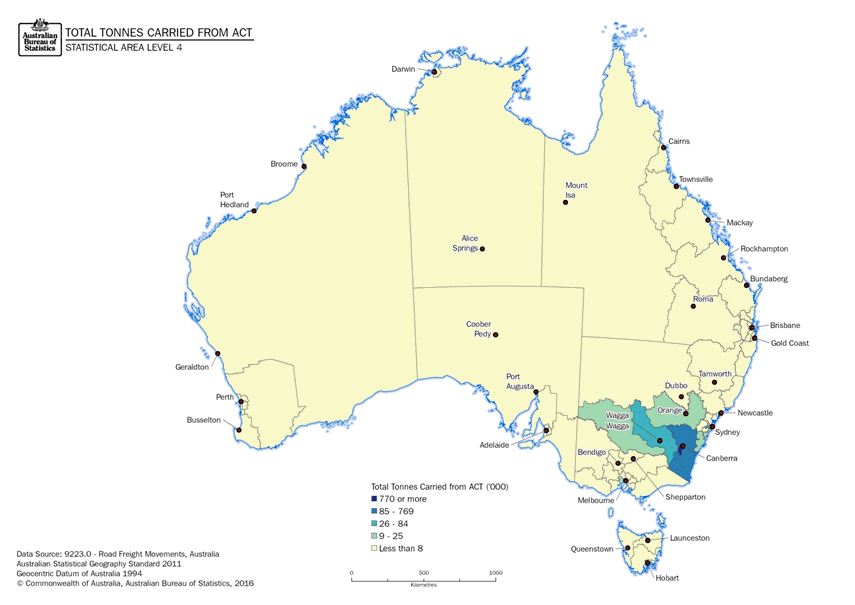
Total Tonnes Carried from the Australian Capital Territory
The following map shows the ranges for Tonnes Carried from Origin (Australian Capital Territory) to Destination (Australia) by Statistical Area Level 4.

 Print Page
 Print All
 Quality Declaration