EMPLOYMENT
This section covers employment in the museums sector using information drawn from three sources - the 1999-2000 ABS Survey of Museums, the April 2001 ABS Survey of Work in Selected Culture and Leisure Activities, and the 2001 Census of Population and Housing. When making comparisons between these sources, it is important to take into consideration the different scope and reference periods of each. Further information on how the data sources differ can be found in Chapter 5.
Survey of Museums
According to the 1999-2000 Survey of Museums, there were 6,956 people employed in museums at the end of June 2000. Of these, 1,741 (25%) worked for Art museums and galleries, 1,010 (15%) worked for Historic properties and 4,205 (60%) worked for Museums not elsewhere classified. There were also 484 people working in museums who were paid by a related organisation rather than by the museum itself.
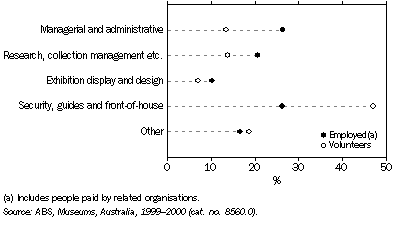
This survey also found that 29,963 people worked as volunteers for museums during the month of June 2000. Almost half the volunteers (47%) were involved as guides or worked in security or front-of-house activities. They were less likely to be involved in managerial, administrative, research, collection management and conservation activities.
8.7 Main type of work undertaken in museums, By whether employed or a volunteer - June 2000

Census of Population and Housing
The 2001 Census of Population and Housing presented a different perspective, with its focus on 5,419 people who nominated working in a museum as their main job (i.e. where they worked the most hours) in the week before Census Night in August 2001. Of these, 34% were employed in cultural occupations such as museum and gallery attendants, curators, conservators or technicians. The 66% of museum employees not in cultural occupations included specialist managers, project and program administrators, security officers, general clerks, tour guides and education officers.
The Census identified an additional 969 people working in a museum-related occupation, but not in a museum (e.g. a conservator working in a library). There were 302 Museum and gallery attendants, 317 Museum and gallery curators, 252 Conservators, and 98 Museum and gallery technicians working in other industries. Almost 60% of persons working in these selected museum-related positions were female.
8.8 PERSONS EMPLOYED IN MUSEUMS INDUSTRY(a), By occupation - August 2001 |
|  |
 |  | Number | % |  |
|  |
| Cultural occupations |  |  |  |
 | Museum and gallery attendants | 562 | 10.4 |  |
 | Museum and gallery curators | 528 | 9.7 |  |
 | Conservators | 152 | 2.8 |  |
 | Museum and art gallery technicians | 121 | 2.2 |  |
 | Historians | 33 | 0.6 |  |
 | Other cultural occupations | 447 | 8.2 |  |
 | Total cultural occupations | 1 843 | 34.0 |  |
| Other occupations |  |  |  |
 | Tour guides | 139 | 2.6 |  |
 | Education officers | 110 | 2.0 |  |
 | Other (includes not stated) | 3 327 | 61.4 |  |
 | Total other occupations | 3 576 | 66.0 |  |
| Total all occupations | 5 419 | 100.0 |  |
|  |
| (a) In their main job in the week before Census Night. |
| ABS, Census of Population and Housing, 2001, data available on request. |
Work Survey
The April 2001 ABS Survey of Work in Selected Culture and Leisure Activities provided yet another perspective, examining 'work involvement' in Museums over a longer period. It included persons who had undertaken paid work in a museum as part of their main job, as well as those whose cultural work involvement was part of a second job or undertaken in a voluntary capacity (i.e. unpaid).
The survey showed that there were 40,800 people aged 15 years and over with a work involvement in Art museums and galleries and 48,200 in Other museums. About one-quarter (25%) of these people received some payment for their involvement.
The reference period for this survey was the 12 months prior to interview, making it more likely to capture those persons working in a cultural occupation on an irregular basis than either the one-week reference period used in the census, or the 'end-of-June 2000 snapshot' provided by the Museums Survey.
 Print Page
 Print All