 LATEST FINDINGS
TIME USE SURVEY
Results from the Time Use Survey, How Australians Use Their Time (cat. no. 4153.0) were released on 21 February 2008. Time use surveys collect detailed information on the daily activity patterns of people in Australia. The information is used to examine how people allocate time to activities such as paid and unpaid work and to analyse such issues as time spent in care giving and balancing family and paid work responsibilities.
Parents Caring for Children
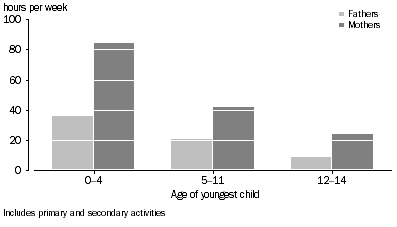
In 2006, women spent nearly three times longer on primary child care activities than men (on average, 59 minutes per day compared with 22 minutes per day) The amount of time that both men and women spent on child care activities has increased compared with data from 1992 and 1997 Time Use Surveys.
Whether parents were employed or not, mothers spent much more time caring for children than fathers. Mothers employed full-time spent 2 hours 17 minutes a day on primary child care activities while fathers spent 1 hour 9 minutes.
The pattern of mothers spending more time than fathers on child care activities was reflected across the age spectrum of the children and across the different types of caring. And for both mothers and fathers, the time spent on caring activities decreased significantly as the age of the youngest child increased.
Time spent on child care by parents of children under 15 years

Time Use by Young People (aged 15-24 years)
The pattern of time use by young people (aged 15 to 24 years), on average, is different to the patterns observed for older age groups - they sleep more and spend more time in education, but spend a lot less time on domestic activities and child care. However, young people are a diverse group of students and non-students, the employed and those that are not employed, and their use of time changes markedly depending on these personal characteristics and on their living arrangements.
Overall young men spent on average, 2 hours 23 minutes per day on education while young women spent 2 hours 22 minutes. For recreation and leisure activities young men, on average, spent 33 hours 57 minutes a week. Most of this time was spent by young men in 'TV watching and listening' and 'other audio/visual' activities, together accounting for a little over half of the recreation and leisure time of young men regardless of their labour force status.
Young women, on average, spent much less time than young men on recreation and leisure activities (29 hours 3 minutes per week). The main recreation and leisure activities of young women were also 'TV watching and listening' and 'other audio/visual' activities accounting for a little over half of all recreation and leisure time regardless of labour force status. |
Young people spent around 30 hours a week with friends. However, as work and family activities increase with age the time spent with friends falls sharply, to around 12 hours per week for people aged 25 to 34 years, and falls to around 7 hours a week for people aged 75 years and over.
POPULATION CHARACTERISTICS OF ABORIGINAL AND TORRES STRAIT ISLANDER AUSTRALIANS, 2006
Population Characteristics of Aboriginal and Torres Strait Islander Australians (cat. no. 4713.0) released in March 2008 presents results from the 2006 Census of Population and Housing on the Indigenous population. Topics covered by the report include: Population structure and distribution; mobility; household composition; language and religious affiliation; education; work; income; and housing and transport. Some selected findings in the report relating to Indigenous children and youth include:
Families and child care
Most Indigenous households consisted of one family. However, Indigenous households were five times more likely than non-Indigenous households to be multi-family households 5% compared 1%. Among one-family households, Indigenous households were three times more likely than other households to be one-parent families with dependants (30% and 10%, respectively) and equally likely to be couples with dependent children (about 37%).
Over a third of Indigenous people (39%) living in occupied private dwellings were children under 15 years, about twice the proportion of the non-Indigenous population (20%).
Over one-third (37%) of Indigenous people spent time caring for either their child and/or someone else's child in the two weeks prior to the 2006 Census, compared with 30% of non-Indigenous people.
Education
In 2006, 11,400 Indigenous children aged 3-5 years were reported to be attending pre-school and 6,800 attending primary school. The level of attendance at pre-school or primary school was similar for Indigenous and non-Indigenous children.
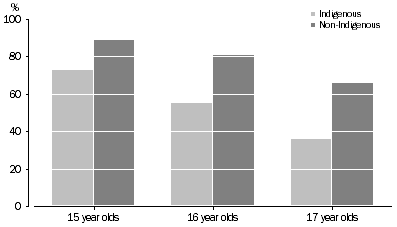
Attended secondary school by age

Indigenous children aged 15-17 years reported consistently lower attendance than non-Indigenous children of the same age. The difference in attendance was more pronounced for 17 year old Indigenous children, with 36% attending secondary school compared with 66% of non-Indigenous children the same age.
In the 2006 Census, of those aged 18-24 years, Indigenous people were less likely to be attending university or a technical or further educational institution than non-Indigenous people - significantly so for university attendance (6% of Indigenous people compared with 25% of non-Indigenous people in this age group).
 Print Page
 Print All