FILE STRUCTURE AND CONTENT
FILE STRUCTURE
The underlying format of the 2015 Characteristics of Employment (COE) TableBuilder file is structured at a single person level. This person level contains general demographic information such as age, sex, country of birth and status of employment as well details about weekly earnings, working arrangements and qualifications.
When tabulating data from TableBuilder, person weights are automatically applied to the underlying sample counts to provide the survey's population estimates.
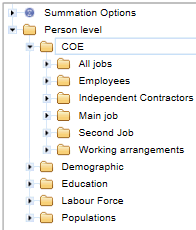
The data items included in the 2015 COE TableBuilder are grouped under broad headings and subheadings as shown in the image below. A complete data items list can be accessed from the Downloads tab.

FILE STRUCTURE
Not Applicable Categories
Most data items included in the TableBuilder file include a 'Not applicable' category. The classification values of these 'Not applicable' categories, where relevant, are shown in the data item list in the Downloads tab. The 'Not applicable' category generally represents the number of people who were not asked a particular question or the number of people excluded from the population for a data item when that data were derived (e.g. Status of employment in second job is not applicable for people without a second job).
Table Populations
The population relevant to each data item is identified in the data item list and should be kept in mind when extracting and analysing data. The actual population count for each data item is equal to the total cumulative frequency minus the 'Not applicable' category.
Generally, some populations can be 'filtered' using other relevant data items. For example, if the population of interest is 'Employees', any data item with that population (excluding the 'Not applicable' category) could be used.
Zero Value Cells
Tables generated from sample surveys will sometimes contain cells with zero values because no respondents that satisfied the parameters of a particular cell in a table were in the survey. This is despite there being people in the general population with those characteristics. This is an example of sampling variability which occurs with all sample surveys. Relative Standard Errors cannot be generated for zero cells.
 Print Page
 Print All