APPENDIX 7 THE DIFFERENCE CORRELATION METHOD FOR UPDATING REGIONAL POPULATION ESTIMATES
INTRODUCTION
A7.1 The difference correlation method is based on determining the relationship between population growth and growth in one or more 'symptomatic indicator(s)' using regression techniques. Symptomatic indicators refer to data which is related to population size. Examples include dwelling counts, Medicare enrolments and numbers of people on the electoral roll.
A7.2 Once the relationship between population growth and growth in the symptomatic indicator(s) has been determined, on the assumption that this relationship is stable over time, it is possible to obtain population estimates for future time periods provided the data on the symptomatic indicator(s) are available for that future date.
A7.3 The assumption that the relationship between population growth and growth in the symptomatic indicator(s) is stable over time leads us to use linear regression techniques.
METHOD
A7.4 To understand the difference correlation method let us define the following:


A7.5 In the difference correlation method, growth is measured in terms of differences between proportions of the state/territory total in the region (for example SLA). Thus population growth between time t and t+n is expressed as:
A7.1

A7.6 Similarly, growth in the symptomatic indicator is given by:
A7.2

A7.7 The following relationship is assumed to exist:
A7.3

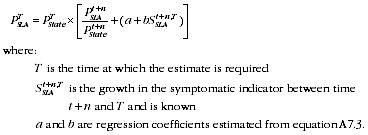
A7.8 With this information, growth in SLA population estimates from time
t+n to time
T can be obtained from equations A7.1, A7.2 and A7.3 as follows:
A7.4

A7.5

or
A7.6

A7.9 The difference correlation method can accommodate more than one symptomatic indicator. In this case, the simple linear regression equation, equation A7.3, is replaced by a multi-variable linear equation of the form:
A7.7

 Print Page
 Print All