|
|
Feature Article - Australia's Trade with the USA
Introduction
This article provides an overview of Australia's international trade in goods and services with the United States of America (USA) over the period from 1994 to 2003, with more detailed analyses of the major commodities and service types traded covering the period from 1998 to 2003.
The purpose of the analyses is to provide an understanding of Australia's trade patterns with the USA in the years prior to the proposed implementation of a free trade agreement between the two nations.
Data on trade in goods are on a recorded trade basis, consistent with the detailed merchandise trade data released by the ABS. Data on trade in services are on a balance of payments basis. This conceptual difference has minimal effect on the analyses.
Merchandise trade data are classified by commodity according to the Standard International Trade Classification (Rev. 3) (SITC). Trade in services data are classified by service type according to the Balance of Payments Services (BOPS) Classification. Information on the current levels of tariffs and quotas for individual commodities has been provided by the Department of Foreign Affairs and Trade.
Further information
Further information can be obtained by contacting Heather Burgess on Canberra 02 6252 7094, or fax 02 6252 7438, or email at heather.burgess@abs.gov.au.
AUSTRALIA'S TRADE
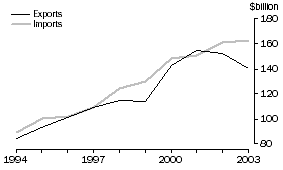
Since 1994 there has been substantial growth both in the value of Australia's total exports (up 67%) and in the value of its imports (up 83%). Australia's exports peaked in 2001 at $154.8b and have declined in each of the past two years reaching $140.5b in 2003. Australia's imports have risen in each of the past ten years, reaching a record $162.9b in 2003.
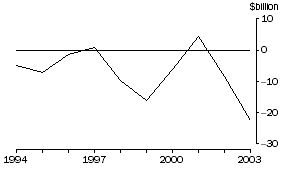
Australia's balance of trade has been volatile in recent years. In the period since 1994, small trade surpluses were achieved in 1997 ($0.8b) and in 2001 ($4.3b), with trade deficits occurring in all other years. The trade deficit was a record $22.4b in 2003, due to a combination of factors including the severe drought affecting agricultural exports, the high value of the Australian dollar relative to other currencies, and the impact of SARS and the war in Iraq on international travel.
1. TOTAL TRADE, Goods and Services
 2. BALANCE OF TRADE, Goods and Services
Exchange rates
Movements in the value of the Australian dollar against other currencies impact on Australia's exports and imports. With an appreciating currency Australia's exports become relatively more expensive to foreign buyers or Australian exporters have to accept lower returns in $A to stay competitive. Imports become relatively cheaper in $A when purchased in foreign currencies. The converse occurs when the currency depreciates.
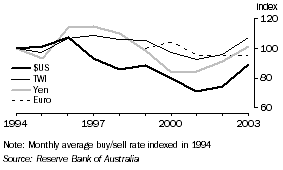
The value of the $A relative to the currencies of our major trading partners, particularly the $US, has varied substantially over the past ten years. It reached a record low value against the $US in 2001, worth, on average 52USc. This record low coincided with the record high value of Australian exports in that year. In the past two years, the $A has recovered much of its lost value, rising by over 25% to an average of 65USc in 2003.
About two-thirds of Australia's goods exports and about one-half of Australia's goods imports are invoiced in $US, with most of the rest invoiced in $A. As a result, changes in the value of the $A against the $US have a substantial impact on the value of exports and imports. Further analysis on trade invoice currencies is available in a separate article on the ABS web site (see Export and Import Currencies, 2003).
The volatility of the $A has been less pronounced against the Trade Weighted Index (TWI). In 2003, the $A was worth only marginally less than the 10 year high in 1997.
3. MOVEMENTS IN SELECTED EXCHANGE RATES
Major trading partners
The USA has been Australia's most important individual trading partner for four of the past six years, just ahead of Japan. Total trade with both the USA and Japan was worth $40.9b in 2003. Australia's total trade with all the countries of the European Union (EU) was valued at $60.2b in 2003.
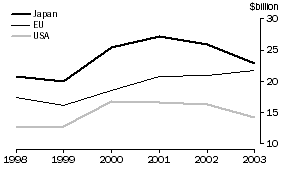
In 2003, Australia's exports to these destinations were: Japan, $22.8b (16% of total exports), EU, $21.8b (16%) and USA, $14.2b (10%). Exports to both Japan and the USA were lower in 2003, compared with the three previous years, whereas total exports to EU countries have risen each year since 1999.
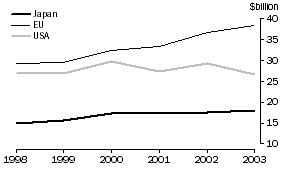
EU countries provided $38.4b (24%) of Australia's imports in 2003. The USA was the most important individual source, accounting for $26.7b (16%) of Australia's imports, followed by Japan with $18.1b (11%).
4. MAJOR EXPORT MARKETS, Goods and Services
 5. MAJOR IMPORT SOURCES, Goods and Services
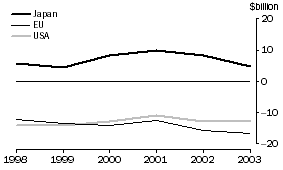
Australia has had substantial trade deficits with the USA and the EU for many years, exceeding $10b in each of the past six years. By contrast, Australia has consistently had a trade surplus with Japan, worth $9.7b in 2001, but falling to $4.8b in 2003.
6. BALANCE OF TRADE, Goods and Services
TRADE WITH USA
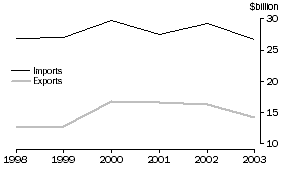
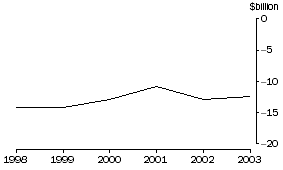
As shown in Graph 7, Australia imports substantially more goods and services from the USA than it exports to it. Australia's trade deficit with the USA has improved slightly since 1998, from a peak of $14.2b in that year, to $12.5b in 2003. It was at its lowest in 2001 at $10.7b, when the $A exchange rate was lowest against the $US.
Between 2000 and 2002 Australia's exports to the USA were worth over $16.2b annually, but they fell to $14.2b in 2003. The USA received 10% of Australia's total exports in 2003, down from 12% in 2000.
The USA's relative importance to Australia as a source of imports has declined steadily over the past five years (down from 22% of total imports in 1998 to 16% in 2003). In 2003, the value of Australia's imports from the USA were at their lowest level of the period studied ($26.7b).
7. TRADE WITH USA, Goods and Services
 8. BALANCE OF TRADE WITH USA, Goods and Services
TRADE IN GOODS
Trade in goods accounts for over 75% of Australia's total trade with the USA. The USA is Australia's second most important market for goods exports, behind Japan, and most important source of goods imports.
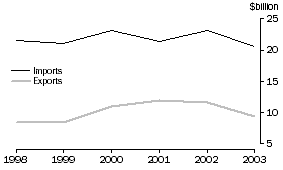
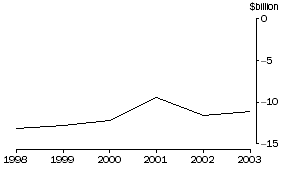
Australia has had a trade in goods deficit with the USA of over $11b in five of the past six years. The deficit peaked at $13.1b in 1998 and was lowest in 2001 at $9.5b. The value of both exports and imports of goods fell in 2003, with the deficit also falling slightly from $11.6b in 2002 to $11.1b in 2003.
9. TRADE WITH USA, Goods
 10. BALANCE OF TRADE WITH USA, Goods
Exports
At the one-digit SITC level, Australia's major goods exports to the USA are Machinery and transport equipment (24% in 2003) and Food and live animals (22%). There are also significant exports of metal ores (part of SITC 2), but these are affected by confidentiality restrictions and are listed under SITC 9 in Table 11 below.
The largest growth occurred in Beverages and tobacco (up 269% since 1998) and Chemicals and related products, nes (up 133%). These were offset by falls in Crude materials, inedible, except fuels (down 55%) and Manufactured goods classified chiefly by material (down 30%). The most significant contributors to the latter decrease were aluminium, with exports to the USA down from $350m in 2001 to $135m in 2003, and zinc, down from $254m in 2000 to $9m in 2003.
11. EXPORTS OF GOODS TO USA |
|  |
 | 1998 | 1999 | 2000 | 2001 | 2002 | 2003 | 2003 | Change from 1998 to 2003 |  |
| SITC code and commodity | $m | $m | $m | $m | $m | $m | % | % |  |
|  |
| 0 Food and live animals | 1,233 | 1,326 | 1,832 | 2,409 | 2,288 | 2,065 | 21.8 | 68 |  |
| 1 Beverages and tobacco | 227 | 276 | 423 | 554 | 769 | 838 | 8.9 | 269 |  |
| 2 Crude materials, inedible, except fuels | 305 | 260 | 372 | 372 | 270 | 137 | 1.5 | -55 |  |
| 3 Mineral fuels, lubricants and related materials | 519 | 531 | 1,248 | 949 | 1,059 | 609 | 6.4 | 17 |  |
| 4 Animal and vegetable oils, fats and waxes | 6 | 5 | 7 | 8 | 7 | 5 | 0.1 | -16 |  |
| 5 Chemicals and related products, nes | 284 | 429 | 551 | 879 | 614 | 664 | 7.0 | 133 |  |
| 6 Manufactured goods classified chiefly by material | 977 | 938 | 1,170 | 1,168 | 1,050 | 688 | 7.3 | -30 |  |
| 7 Machinery and transport equipment | 1,931 | 2,043 | 2,379 | 2,741 | 3,062 | 2,236 | 23.7 | 16 |  |
| 8 Miscellaneous manufactured articles | 530 | 602 | 807 | 955 | 879 | 766 | 8.1 | 44 |  |
| 9 Commodities and transactions not classified elsewhere in the SITC | 2,463 | 2,002 | 2,191 | 1,879 | 1,548 | 1,445 | 15.3 | -41 |  |
| Total | 8,476 | 8,411 | 10,980 | 11,914 | 11,546 | 9,453 | 100.0 | 12 |  |
|  |
Major commodity exports
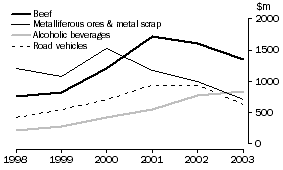
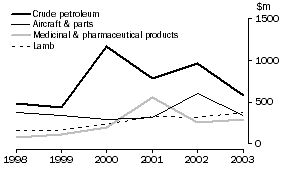
Graphs 12 and 13 show the top eight commodity exports to the USA over the past six years. Graphs 14 to 21 show the value and volume of exports for some of these commodities.
12. MAJOR EXPORTS TO USA, Goods
 13. OTHER MAJOR EXPORTS TO USA, Goods
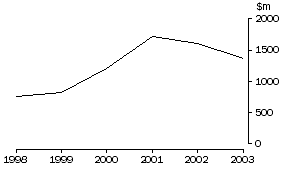
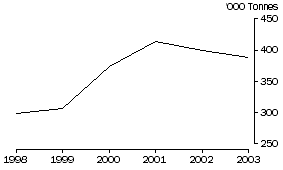
Beef has been Australia's major goods export to the USA for the past three years, accounting for $1,357m (14%) of Australia's goods exports to that country in 2003. Since 1998, the volume of beef exports to USA has risen by 30%, while the value of beef exports has risen by 81%.
Australia's beef exports are subject to a quota of 378,214 tonnes annually which was negotiated to meet the USA's World Trade Organization (WTO) obligations. Exports below this are subject to a US4.4c per kilogram tariff, whereas exports above this figure attract a much higher tariff of 26.4%. For the last three years, Australia's beef exports to the USA have been at or near the quota. Under the proposed free trade agreement, the quota would be gradually lifted to 448,214 tonnes over an 18 year period.
14. BEEF EXPORTS TO USA, Value
 15. BEEF EXPORTS TO USA, Gross weight
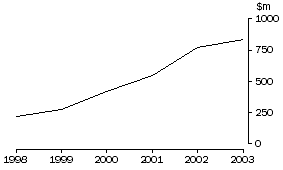
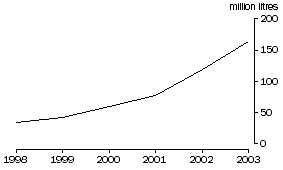
Wine was Australia's second most important export to the USA in 2003, worth $837m and exceeding exports of metalliferous ores and road vehicles for the first time. There has been a more than threefold increase in both the value (up 273%) and quantity (up 384%) of wine exported to the USA since 1998. The USA currently has relatively low tariffs on wine imports, ranging between US8.4c and US22.4c per litre depending on the type of wine and container. Under the proposed free trade agreement, tariffs would be phased out over 11 years.
16. WINE EXPORTS TO USA, Value
 17. WINE EXPORTS TO USA, Quantity
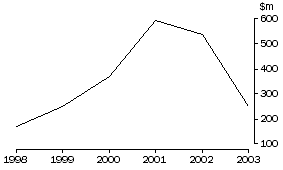
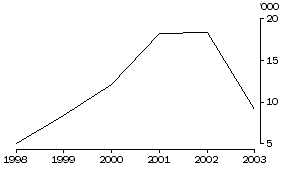
Exports of motor cars to the USA more than tripled between 1998 and 2001. However, in 2003, much of this growth was reversed, both in terms of the value and numbers of cars exported. The value of car exports last year was less than half that of 2002, $251m (9,153 vehicles) compared with $538m (18,297 vehicles). The rise in the value of the $A against the $US was the major contributing factor to this fall.
Most cars and parts are duty free or subject to a 2.5% tariff in the USA. The exception is light commercial vehicles (utilities) which have a 25% tariff applied in the USA. The USA does not produce a comparable vehicle. Under the proposed free trade agreement these tariffs would be abolished immediately.
18. CAR EXPORTS TO USA, Value
 19. CAR EXPORTS TO USA, Number
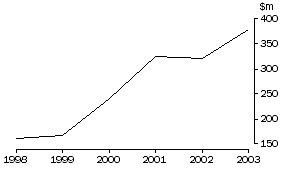
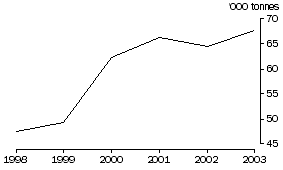
Lamb is Australia's second most important food export to the USA with the value of exports having risen by 42% since 1998. 67,600 tonnes of lamb and sheep meat valued at $377m were exported to the USA in 2003. There are no quotas on lamb imports into the USA and current tariff levels are relatively low, at generally less than US1c per kilogram. Lamb and sheep meat would be tariff free immediately under the proposed free trade agreement.
20. LAMB EXPORTS TO USA, Value
 21. LAMB EXPORTS TO USA, Gross weight
As shown in Graphs 12 and 13, many of Australia's major exports to the USA have declined in value in the past year or two, largely due to the appreciation of the Australian dollar. These include exports of:
- metalliferous ores and metal scrap, $708m in 2003, down by over 50% from $1,525m in 2000;
- crude petroleum, $583m in 2003, 50% less than the $1,166m of exports in 2000;
- road vehicles (including parts), $633m in 2003, compared with $940m in both 2001 and 2002;
- medicinal and pharmaceutical products, $291m in 2003, after peaking at $561m in 2001; and
- aircraft and parts, $342m in 2003, returning to more normal levels, following the substantial one-off re-export of $322m of secondhand planes in 2002.
Imports
At the one-digit SITC level, Australia's major goods imports from the USA are Machinery and transport equipment (57% of total imports in 2003), Chemicals and related products, nes (15%) and Miscellaneous manufactured articles (15%) (Table 22). There has been relatively little change in the value of these imports in the past five years. Across almost all categories, the value of imports from the USA was lower in 2003 than 2002, due largely to the increased value of the $A.
22. IMPORTS OF GOODS FROM USA |
|  |
 | 1998 | 1999 | 2000 | 2001 | 2002 | 2003 | 2003 | Change from 1998 to 2003 |  |
| SITC code and commodity | $m | $m | $m | $m | $m | $m | % | % |  |
|  |
| 0 Food and live animals | 436 | 397 | 417 | 458 | 501 | 537 | 2.6 | 23 |  |
| 1 Beverages and tobacco | 103 | 129 | 147 | 183 | 202 | 190 | 0.9 | 85 |  |
| 2 Crude materials, inedible, except fuels | 255 | 279 | 297 | 224 | 199 | 186 | 0.9 | -27 |  |
| 3 Mineral fuels, lubricants and related materials | 258 | 198 | 215 | 273 | 291 | 207 | 1.0 | -20 |  |
| 4 Animal and vegetable oils, fats and waxes | 6 | 7 | 6 | 6 | 9 | 10 | - | 58 |  |
| 5 Chemicals and related products, nes | 2,890 | 2,797 | 3,500 | 3,595 | 3,204 | 3,071 | 15.0 | 6 |  |
| 6 Manufactured goods classified chiefly by material | 1,788 | 1,612 | 1,598 | 1,613 | 1,600 | 1,472 | 7.2 | -18 |  |
| 7 Machinery and transport equipment | 11,294 | 11,536 | 12,729 | 11,169 | 13,650 | 11,617 | 56.6 | 3 |  |
| 8 Miscellaneous manufactured articles | 3,283 | 3,264 | 3,485 | 3,373 | 3,164 | 2,996 | 14.6 | -9 |  |
| 9 Commodities and transactions not classified elsewhere in the SITC | 1,236 | 919 | 729 | 506 | 327 | 243 | 1.2 | -80 |  |
| Total | 21,549 | 21,140 | 23,122 | 21,399 | 23,147 | 20,529 | 100.0 | -5 |  |
|  |
| - nil or rounded to zero (including null cells) |
Major commodity imports
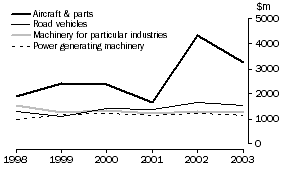
Graphs 23 and 24 show the top eight commodity imports from the USA over the past six years. Over the past two years, Australia's major import from the USA, by a significant margin, has been aircraft and parts. These were worth $4.3b in 2002 and $3.3b in 2003. This has been due to Australia's major airlines upgrading their fleets and this is expected to continue for a number of years.
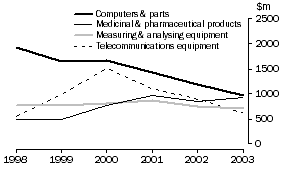
Imports of other major commodities have been relatively static over the past five years or have declined. The most significant fall has been imports of computers and parts, down by almost 50% from $1,933m in 1998 to $978m in 2003, partly due to a steady fall in computer prices. Imports of telecommunications equipment peaked in 2000 at $1,510m due to a period of significant investment in infrastructure. They have declined steadily since, to $616m in 2003.
23. MAJOR GOODS IMPORTS FROM USA
24. OTHER MAJOR GOODS IMPORTS FROM USA
Import duties
In 2003, $5.1b of duty was collected on imported goods, of which $731m (14%) was from goods imported from the USA. Almost 60% ($423m) of the duty collected on USA imports was from beverages ($303m) and tobacco ($120m). The majority of this duty is set at a rate to align with the excise levied on sales of the comparable Australian produced goods. Under the free trade agreement, only the duty component not related to excise (generally 5%) will be abolished.
Machinery and transport ($161m) was the next most important, accounting for 22% of the duty collected on USA imports in 2003. Approximately one-third was from road vehicles and parts and the majority of the rest from industrial machinery. Cars and most car parts attract a 15% duty while the duty on most industrial machinery is either 5% or nil.
Many goods imported from the USA attract no duty, while most others have a 5% duty. In 2003, this resulted in an average duty rate for total imports from the USA of 3.6%. For all commodities excluding beverages and tobacco, the average rate of duty was 1.5%.
Under the proposed free trade agreement almost all goods imported from the USA will become duty-free immediately upon the Agreement coming into force. The main exceptions are cars, textiles and clothing which would have tariffs phased out. All Australian tariffs on goods imported from the USA would be zero by 2015 if the Agreement is implemented as proposed.
25. IMPORT DUTIES COLLECTED, 2003 |
|  |
 | ALL COUNTRIES
| USA
|  |
 | Imports | Duties | Imports | Duties | Duties | Average rate of duty | Proportion all countries duties |  |
| SITC code and commodity | $m | $m | $m | $m | % | % | % |  |
|  |
| 0 Food and live animals | 5,171 | 69 | 537 | 9 | 1.3 | 1.7 | 13.6 |  |
| 1 Beverages and tobacco | 960 | 1,479 | 190 | 423 | 57.9 | 222.7 | 28.6 |  |
| 2 Crude materials, inedible, except fuels | 1,938 | 13 | 186 | 1 | 0.2 | 0.7 | 10.1 |  |
| 3 Mineral fuels, lubricants and related materials | 10,046 | 40 | 207 | 1 | 0.1 | 0.3 | 1.7 |  |
| 4 Animal and vegetable oils, fats and waxes | 356 | 3 | 10 | - | - | 0.8 | 2.8 |  |
| 5 Chemicals and related products, nes | 14,935 | 203 | 3,071 | 49 | 6.6 | 1.6 | 23.9 |  |
| 6 Manufactured goods classified chiefly by material | 15,809 | 608 | 1,472 | 48 | 6.6 | 3.3 | 7.9 |  |
| 7 Machinery and transport equipment | 59,170 | 1,602 | 11,617 | 161 | 22.0 | 1.4 | 10.0 |  |
| 8 Miscellaneous manufactured articles | 18,347 | 1,057 | 2,996 | 34 | 4.7 | 1.1 | 3.2 |  |
| 9 Commodities and transactions not classified elsewhere in the SITC | 3,270 | 23 | 243 | 5 | 0.6 | 1.9 | 19.4 |  |
| Total | 130,001 | 5,097 | 20,529 | 731 | 100.0 | 3.6 | 14.3 |  |
|  |
| - nil or rounded to zero (including null cells) |
SERVICES
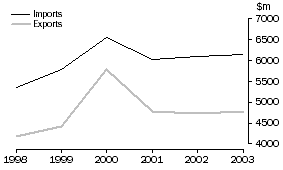
The USA is Australia's most important trading partner for both exports and imports of services. Australia's exports of services to the USA peaked in 2000 at $5.8b due to the Sydney Olympic Games. Since then exports have been relatively stable at just under $4.8b. Imports of services from the USA also peaked in 2000 at $6.6b, partly due to the Games, but not as significantly as for exports. For the past three years, imports of services from the USA have been worth around $6.1b annually.
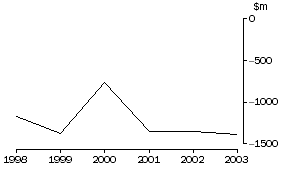
Australia has had a deficit in trade in services with the USA for the entire period covered by the analysis. Apart from 2000 when the deficit fell to $771m, Australia has consistently had a deficit of almost $1.4b annually since 1999.
26. TRADE WITH USA, Services
 27. BALANCE OF TRADE WITH USA, Services
Exports by service type
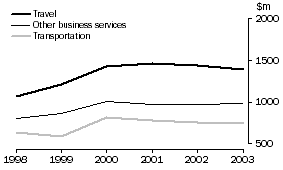
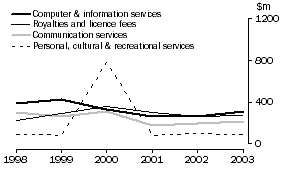
Table 28 shows Australia's exports to the USA since 1998, by type of service. Graphs 29 and 30 show selected service types.
28. EXPORTS OF SERVICES TO USA |
|  |
 | 1998 | 1999 | 2000 | 2001 | 2002 | 2003 | 2003 | Change from 1998 to 2003 |  |
| Type of service | $m | $m | $m | $m | $m | $m | % | % |  |
|  |
| Transportation services | 643 | 588 | 814 | 785 | 754 | 747 | 15.7 | 16 |  |
| Travel services | 1,064 | 1,218 | 1,435 | 1,460 | 1,439 | 1,398 | 29.3 | 31 |  |
| Communication services | 304 | 269 | 309 | 180 | 199 | 217 | 4.6 | -29 |  |
| Construction services | - | - | 2 | - | - | 2 | 0.1 | 1,352 |  |
| Insurance services | 359 | 343 | 317 | 285 | 284 | 286 | 6.0 | -20 |  |
| Financial services | 216 | 244 | 272 | 285 | 294 | 300 | 6.3 | 39 |  |
| Computer and information services | 388 | 425 | 334 | 265 | 267 | 316 | 6.6 | -19 |  |
| Royalties and licence fees | 228 | 298 | 359 | 302 | 264 | 272 | 5.7 | 19 |  |
| Other business services | 810 | 864 | 1,008 | 978 | 976 | 982 | 20.6 | 21 |  |
| Personal, cultural and recreational services | 94 | 84 | 784 | 85 | 102 | 89 | 1.9 | -6 |  |
| Government services n.i.e. | 89 | 86 | 156 | 153 | 154 | 169 | 3.5 | 89 |  |
| Total service exports | 4,195 | 4,419 | 5,789 | 4,779 | 4,732 | 4,771 | 100.0 | 14 |  |
|  |
| - nil or rounded to zero (including null cells) |
Travel services, other business services and transportation services are Australia's three major service exports to the USA. They accounted for almost two thirds of Australia's total service exports to that country in 2003 and were worth, respectively, $1,398m (29%), $982m (21%) and $747m (16%). Exports of each of these services have increased by between 16% and 31% since 1998. However, levels have been relatively stable for the past four years.
The effect of the Sydney Olympic Games in 2000 was most evident for exports of personal, cultural and recreational services which were boosted by $700m in that year.
Under the proposed free trade agreement Australia - USA trade in services will be enhanced by the introduction of a framework to promote mutual recognition of qualifications, and Australia becoming a "designated" country in USA law, allowing Australian companies to bid on USA federal government contracts.
29. MAJOR EXPORTS TO USA, Services
 30. SELECTED EXPORTS TO USA, Services
Imports by service type
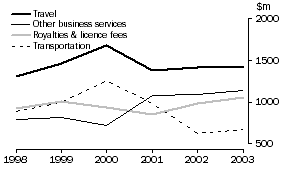
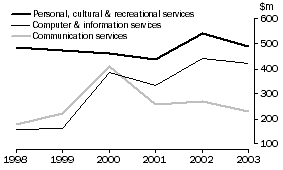
Table 31 shows Australia's imports from the USA since 1998, by type of service. Graphs 32 and 33 show selected service types.
31. IMPORTS OF SERVICES FROM USA |
|  |
 | 1998 | 1999 | 2000 | 2001 | 2002 | 2003 | 2003 | Change from 1998 to 2003 |  |
| Type of service | $m | $m | $m | $m | $m | $m | % | % |  |
|  |
| Transportation services | 891 | 1,000 | 1,255 | 984 | 628 | 674 | 11.0 | -24 |  |
| Travel services | 1,306 | 1,459 | 1,681 | 1,376 | 1,420 | 1,423 | 23.1 | 9 |  |
| Communication services | 179 | 223 | 412 | 256 | 270 | 230 | 3.7 | 29 |  |
| Construction services | - | - | - | - | - | - | - | - |  |
| Insurance services | 318 | 316 | 315 | 295 | 297 | 299 | 4.9 | -6 |  |
| Financial services | 142 | 169 | 189 | 191 | 189 | 184 | 3.0 | 29 |  |
| Computer and information services | 158 | 162 | 385 | 334 | 443 | 422 | 6.9 | 167 |  |
| Royalties and licence fees | 921 | 1,011 | 943 | 857 | 984 | 1,059 | 17.2 | 15 |  |
| Other business services | 796 | 820 | 728 | 1,078 | 1,092 | 1,139 | 18.5 | 43 |  |
| Personal, cultural and recreational services | 484 | 471 | 460 | 437 | 541 | 491 | 8.0 | 2 |  |
| Government services n.i.e. | 170 | 165 | 192 | 202 | 217 | 230 | 3.7 | 35 |  |
| Total service imports | 5,363 | 5,797 | 6,560 | 6,009 | 6,082 | 6,151 | 100.0 | 15 |  |
|  |
| - nil or rounded to zero (including null cells) |
Travel services account for nearly one-quarter of Australia's service imports from the USA. They were worth $1,423m in 2003. Other business services, and royalties and licence fees, have been the next most important service imports for the past two years. Imports of these services were worth, respectively, $1,139m (18%) and $1,059m (17%) in 2003.
Transportation services imports from the USA rose steadily until 2000, from $891m to $1,255m. They have since almost halved to be worth $674m in 2003. The main contributing factor to this fall was a reduction in the import of freight services, mainly due to competitive pressures on freight rates in sea traffic between Australia and North America.
The effect of the Olympic Games can be seen on imports of travel services. The Olympic Games also affected imports of communication services due to work undertaken to improve communication networks in readiness for the Games. Since then imports have dropped back to less than $300m annually.
Imports of personal, cultural and recreational services have been relatively stable for the past six years, generally around $500m, while imports of computer and information services have exceeded $400m for the past two years.
32. MAJOR SERVICE IMPORTS FROM USA
 33. SELECTED SERVICE IMPORTS FROM USA
FREE TRADE AGREEMENT
The Australia - USA Free Trade Agreement (AUSFTA) negotiations were completed in February 2004. The AUSFTA must now be ratified by the governments of both Australia and the USA before it can come into effect. The Agreement is scheduled to be considered by the legislatures of each nation during 2004.
More information about the details of the AUSFTA and its possible impacts on trade between the two nations is available from the web sites of the appropriate government agencies, the Department of Foreign Affairs and Trade in Australia (www.dfat.gov.au) and the Office of the United States Trade Representative in the USA (www.ustr.gov).
LEGEND
34. LEGEND |
|  |
| Term used | SITC |  |
|  |
| Beef | 11 |  |
| Lamb | 12 |  |
| Alcoholic beverages | 112 |  |
 | Wine | 11215 and 11217 |  |
| Metalliferous ores & metal scrap | 28 |  |
| Crude petroleum | 333 |  |
| Medicinal & pharmaceutical products | 54 |  |
| Aluminium | 684 |  |
| Zinc | 686 |  |
| Power generating machinery | 71 |  |
| Machinery for particular industries | 72 |  |
| Computers & parts | 752 and 759 |  |
| Telecommunications equipment | 764 |  |
| Road vehicles | 78 |  |
 | Cars | 781 |  |
| Aircraft & parts | 792 |  |
| Measuring/analysing equipment | 874 |  |
|  |
APPENDIX
TRADE IN GOODS AND SERVICES(a) |
|  |
 | EXPORTS
| IMPORTS
| BALANCE OF TRADE
|  |
 | Total | To USA | USA share of total | Total | From USA | USA share of total | Total | With USA |  |
| Year | $m | $m | % | $m | $m | % | $m | $m |  |
GOODS |  |
|  |
| 1994 | 64,776 | 4,645 | 7.2 | 68,099 | 14,938 | 21.9 | -3,323 | -10,293 |  |
| 1995 | 71,671 | 4,626 | 6.5 | 77,469 | 16,735 | 21.6 | -5,798 | -12,109 |  |
| 1996 | 76,983 | 4,978 | 6.5 | 78,410 | 18,017 | 23.0 | -1,427 | -13,039 |  |
| 1997 | 84,790 | 6,339 | 7.5 | 83,418 | 18,174 | 21.8 | 1,372 | -11,836 |  |
| 1998 | 88,985 | 8,476 | 9.5 | 96,773 | 21,549 | 22.3 | -7,788 | -13,073 |  |
| 1999 | 86,893 | 8,411 | 9.7 | 101,517 | 21,140 | 20.8 | -14,624 | -12,729 |  |
| 2000 | 110,354 | 10,980 | 10.0 | 116,955 | 23,122 | 19.8 | -6,601 | -12,142 |  |
| 2001 | 122,530 | 11,914 | 9.7 | 117,746 | 21,399 | 18.2 | 4,784 | -9,485 |  |
| 2002 | 119,458 | 11,546 | 9.7 | 127,666 | 23,147 | 18.1 | -8,208 | -11,601 |  |
| 2003 | 107,917 | 9,453 | 8.8 | 130,001 | 20,529 | 15.8 | -22,084 | -11,076 |  |
SERVICES |  |
|  |
| 1994 | 19,394 | na | na | 21,111 | na | na | -1,717 | na |  |
| 1995 | 21,776 | na | na | 23,083 | na | na | -1,307 | na |  |
| 1996 | 23,704 | na | na | 23,755 | na | na | -51 | na |  |
| 1997 | 24,844 | na | na | 25,396 | na | na | -552 | na |  |
| 1998 | 25,689 | 4,195 | 16.3 | 27,515 | 5,363 | 19.5 | -1,826 | -1,167 |  |
| 1999 | 26,980 | 4,419 | 16.4 | 28,397 | 5,797 | 20.4 | -1,417 | -1,378 |  |
| 2000 | 32,130 | 5,789 | 18.0 | 31,699 | 6,560 | 20.7 | 431 | -771 |  |
| 2001 | 32,246 | 4,779 | 14.8 | 32,767 | 6,009 | 18.3 | -521 | -1,230 |  |
| 2002 | 32,976 | 4,732 | 14.4 | 33,261 | 6,082 | 18.3 | -285 | -1,349 |  |
| 2003 | 32,583 | 4,771 | 14.6 | 32,943 | 6,151 | 18.7 | -360 | -1,379 |  |
TOTAL |  |
|  |
| 1994 | 84,170 | na | na | 89,210 | na | na | -5,040 | na |  |
| 1995 | 93,447 | na | na | 100,552 | na | na | -7,105 | na |  |
| 1996 | 100,687 | na | na | 102,165 | na | na | -1,478 | na |  |
| 1997 | 109,634 | na | na | 108,814 | na | na | 820 | na |  |
| 1998 | 114,674 | 12,671 | 11.0 | 124,288 | 26,912 | 21.7 | -9,614 | -14,240 |  |
| 1999 | 113,873 | 12,830 | 11.3 | 129,914 | 26,937 | 20.7 | -16,041 | -14,107 |  |
| 2000 | 142,484 | 16,769 | 11.8 | 148,654 | 29,683 | 20.0 | -6,170 | -12,913 |  |
| 2001 | 154,776 | 16,692 | 10.8 | 150,513 | 27,408 | 18.2 | 4,263 | -10,716 |  |
| 2002 | 152,434 | 16,278 | 10.7 | 160,927 | 29,228 | 18.2 | -8,493 | -12,950 |  |
| 2003 | 140,500 | 14,224 | 10.1 | 162,944 | 26,680 | 16.4 | -22,444 | -12,455 |  |
|  |
| na not available |
| (a) Calendar year estimates for trade in services by country are not available prior to 1998. |
|
 (301 bytes)
 |
|
 Print Page
 Print All