ANALYSIS AND COMMENTS
BALANCE OF PAYMENTS
CURRENT ACCOUNT
The trend estimate of the balance on current account for the December quarter 2007 was a deficit of $18,470m. This was an increase of $1,435m (8%) on the deficit recorded for the September quarter 2007 where:
- the goods and services deficit rose $1,242m (24%) to $6,327m
- the income deficit rose $216m (2%) to $12,096m
- the current transfers deficit fell $23m (33%) to $47m.
In seasonally adjusted terms, the current account deficit rose $2,997m (18%) to $19,349m between the September quarter 2007 and December quarter 2007 where:
- the goods and services deficit rose $2,071m (43%) to $6,860m
- the income deficit rose $913m (8%) to $12,440m
- the current transfers deficit rose $12m (32%) to $49m.
Goods and Services
The trend estimate of the balance on goods and services at current prices was a deficit of $6,327m, an increase of $1,242m (24%) on the September quarter 2007 deficit.
In seasonally adjusted terms, the balance on goods and services was a deficit of $6,860m, an increase of $2,071m (43%) on the September quarter 2007 deficit where:
- the net goods deficit rose $1,847m (35%) to $7,159m
- the net services surplus fell $224m (43%) to $299m.
The increase in the goods deficit resulted from higher goods debits (imports), up $1,460m (3%), and lower goods credits (exports), down $387m (1%).
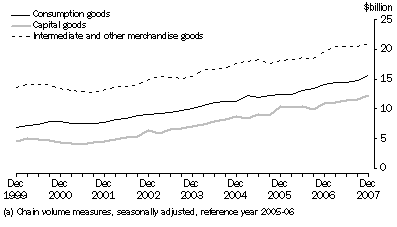
Contributing to the increase in goods debits were:
- intermediate and other merchandise goods, up $821m (4%)
- consumption goods, up $572m (4%)
- capital goods, up $320m (3%).
Partly offsetting these increases was a fall in the other goods component, down $253m (11%).
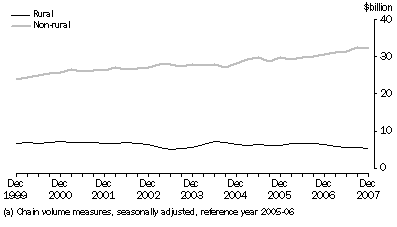
The decrease in goods credits was due mainly to a fall in the non-rural goods component, down $631m (2%), partly offset by:
- rural goods, up $189m (3%)
- other goods, up $54m (2%).
The decrease in the services surplus resulted from higher services debits, up $441m (4%), partly offset by higher services credits, up $217m (2%).
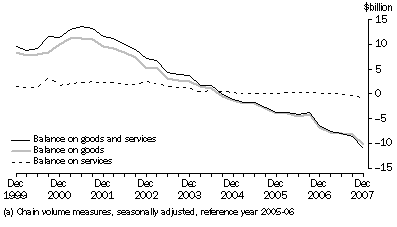
In seasonally adjusted volume terms, the deficit on goods and services was $11,027m, an increase of $2,502m (29%) on the $8,525m deficit recorded in the September quarter 2007. The net deficit on goods rose $1,982m (24%) to $10,115m. Goods credits fell $458m (1%) and goods debits rose $1,524m (3%). The net services balance was a deficit of $912m, an increase of $521m (133%) on the deficit of $391m in September quarter 2007.
The increase of $2,502m in the deficit on goods and services in volume terms could be expected to detract -1.0 percentage points to growth in the December quarter 2007 volume measures of GDP, assuming no significant revision to the GDP chain volume estimate for the September quarter 2007.
.
Goods and Services(a)
Goods Credits
The trend estimate of goods credits fell $244m (1%) to $42,079m in the December quarter 2007.
In seasonally adjusted current price terms, goods credits fell $387m (1%) to $41,937m.
Exports of rural goods, in seasonally adjusted terms at current prices, rose $189m (3%) to $5,960m, with volumes down 1% and price up 4%. The main increases were in:
- wool and sheepskins, up $136m (21%), with volumes up 16% and prices up 5%
- other rural, up $128m (5%), with prices up 5%.
Partly offsetting these increases was the cereal grains and cereal preparations component, down $91m (10%), with volumes down 27% and prices up 22%.
Exports of non-rural goods, in seasonally adjusted terms at current prices, fell $631m (2%) to $32,571m, with prices down 1%. The largest decreases were in:
- metal ores and minerals, down $765m (8%), with volumes down 3% and prices down 5%
- other non-rural (including sugar and beverages), down $231m (7%), with volumes down 8% and prices up 1%
- metals (excluding non-monetary gold), down $210m (6%), with prices down 6%
- other manufactures, down $179m (4%), with volumes down 4%.
Partly offsetting these decreases was a rise in the other mineral fuels component, up $778m (21%), with volumes up 8% and prices up 12%.
Exports of other goods, in seasonally adjusted terms at current prices, rose $54m (2%) to $3,406m. The main contributor to this increase was the goods procured in ports by carriers component, up $55m (16%), with volumes up 3% and prices up 13%.
General Merchandise Credits(a)
Goods Debits
The trend estimate of goods debits rose $908m (2%) to $48,794m in the December quarter 2007.
In seasonally adjusted current price terms, goods debits rose $1,460m (3%) to $49,096m.
Imports of consumption goods, in seasonally adjusted terms at current prices, rose $572m (4%) to $14,639m, with volumes up 6% and prices down 2%. The largest increases were in:
- non-industrial transport equipment, up $481m (13%), with volumes up 13%
- consumption goods n.e.s., up $75m (2%), with volumes up 4% and prices down 2%
- toys, books and leisure goods, up $57m (5%), with volumes up 9% and prices down 4%.
Partly offsetting these increases was the food and beverages, mainly for consumption component, down $89m (5%), with volumes down 3% and prices down 2%.
Imports of capital goods, in seasonally adjusted terms at current prices, rose $320m (3%) to $10,910m, with volumes up 6% and prices down 3%. The largest increases were in:
- telecommunications equipment, up $167m (12%), with volumes up 18% and prices down 5%
- civil aircraft, up $109m (29%), with volumes up 34% and prices down 4%
- industrial transport equipment n.e.s., up $83m (5%), with volumes up 4% and prices up 1%.
Partly offsetting these increases was the machinery and industrial equipment component, down $115m (3%), with volumes down 2% and prices down 1%.
Imports of intermediate and other merchandise goods, in seasonally adjusted terms at current prices, rose $821m (4%) to $21,510m, with volumes up 2% and prices up 2%. The largest increases were in:
- fuels and lubricants, up $843m (14%), with prices up 14%
- processed industrial supplies n.e.s., up $334m (7%), with volumes up 10% and prices down 2%
- other merchandise goods, up $42m (14%), with volumes up 14%.
Partly offsetting these increases were falls in:
- organic and inorganic chemicals, down $249m (20%), with volumes down 20%
- iron and steel, down $86m (9%), with volumes down 5% and prices down 4%
- paper and paperboard, down $49m (8%), with volumes down 9% and prices up 1%.
Imports of other goods, in seasonally adjusted terms at current prices, fell $253m (11%) to $2,037m. The main component contributing to the fall was non-monetary gold, down $276m (15%), with volumes down 23% and prices up 10%, partly offset by goods procured in ports by carriers, up $20m (6%), with volumes down 8% and prices up 15%.
General Merchandise Debits(a)
Services
The trend estimate of net services at current prices was a surplus of $388m, a decrease of $90m (19%) on the September quarter 2007 surplus of $478m.
In seasonally adjusted terms at current prices, net services recorded a surplus of $299m, a decrease of $224m (43%) on the September quarter 2007 surplus of $523m.
Services credits, in seasonally adjusted terms at current prices, rose $217m (2%) to $12,357m, with volumes up 1% and prices up 1%. The main components contributing to the rise in the seasonally adjusted series were:
- other services, up $150m (5%), with volumes up 4% and prices up 1%
- travel services, up $69m (1%), with prices up 1%.
Partly offsetting these effects was the transportation services component, down $2m.
Services debits, in seasonally adjusted terms at current prices, rose $441m (4%) to $12,058m, with volumes up 5% and prices down 2%. All components contributed to the rise in the seasonally adjusted series with:
- travel services, up $183m (4%), with volumes up 6% and prices down 1%
- other services, up $139m (4%), with volumes up 6% and prices down 2%
- transportation services, up $119m (3%), with volumes up 4% and prices down 1%.
Seasonally adjusted, tourism related services credits rose $71m (1%) to $7,833m, and tourism related services debits rose $240m (4%) to $6,264m.
IMPLICIT PRICE DEFLATOR
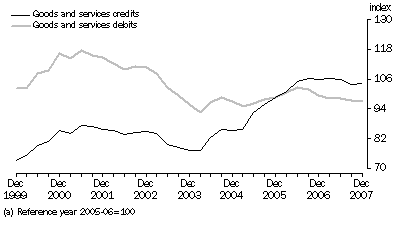
In seasonally adjusted terms, the implicit price deflator (IPD) for total goods and services credits rose 0.3%. In original terms, it rose by 0.5%. The chain Laspeyres price index for goods and services credits rose 1.0%. In original terms, the IPD for goods credits rose 0.4% and the IPD for services credits rose 0.7%.
The total goods and services debits IPD fell 0.3% in seasonally adjusted terms. In original terms, it fell by 0.6% and the chain Laspeyres price index for goods and services debits rose 0.3%. In original terms, the IPD for goods debits fell 0.3% and the IPD for services debits fell 1.6%.
IMPLICIT PRICE DEFLATOR(a)
Relationship to IPI and EPI
In original terms, the implicit price deflator for total goods credits rose 0.4% while the chain Laspeyres price index for goods exports rose 1.0%. The export price index (EPI) fell 0.6% during the December quarter 2007.
In original terms, the implicit price deflator for total goods debits fell 0.3% while the chain Laspeyres price index for goods imports rose 0.6%. The import price index (IPI) rose 0.2% during the December quarter 2007.
Terms of trade
Australia's seasonally adjusted terms of trade rose 0.7% to 107.6, with an increase of 0.3% in the IPD for goods and services credits and a decrease of 0.3% in the goods and services debits IPD. The trend estimate of the terms of trade decreased 0.1% to 107.3.
Income
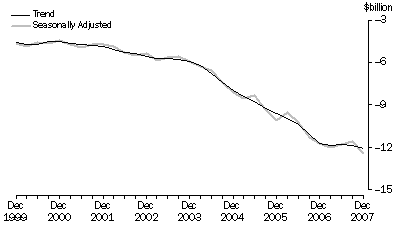
The trend estimate of the net income deficit increased $216m (2%) to $12,096m.
In seasonally adjusted terms the net income deficit rose $913m (8%) to $12,440m. Income credits fell $1,040m (11%) to $8,207m and income debits fell $127m (1%) to $20,647m. The main components contributing to the fall in income credits were a fall in profit accruing to Australian direct investors due to a fall in commodity prices and divestment of non-resident subsidiaries, and a fall in interest payments on other investment assets (consistent with the reduction in reserve assets). The main driver to the decrease in income debits was a $473m (7%) decrease in portfolio investment income on debt.
In original terms the net income deficit fell $574m (4%) to $12,359m. Income credits fell $989m (11%) to $7,907m. Income debits decreased $1,563m (7%) to $20,266m.
Net Income
Current Transfers
In seasonally adjusted terms, the net current transfers deficit was $49m, an increase of $12m (32%) on the $37m deficit recorded in the September quarter 2007. Current transfer credits fell $19m (1%) and current transfer debits fell $7m (1%).
CAPITAL AND FINANCIAL ACCOUNT
Capital Account
In original terms, the capital account surplus was $485m, down $101m (17%) on the revised September quarter 2007 surplus. Capital transfer credits fell $30m (4%) to $786m and capital transfer debits rose $72m (31%) to $302m.
Financial Account
The main influence on the financial account during the December quarter 2007 continued to be the reaction to events in global credit markets. The higher cost of raising debt in the short term money market has been reflected in a significant decrease in overseas money market borrowings by Australian resident depository corporations (down $19.5b) with a shift into short term loans and cash on deposit. However, the overall level of overseas borrowing by depository corporations has recovered somewhat in December quarter 2007 (up $5.7b) after a significant fall in September quarter 2007 (down $17.8b). Nevertheless, the overall level of overseas borrowing by resident depository corporations remains below levels reported prior to the September quarter 2007.
Australian resident securitisers also experienced a significant reduction in overseas borrowings and, as with the September quarter 2007, there were no new issues of Kangaroo bonds during the December quarter 2007. The significant contraction in derivatives activity was also a feature during the December quarter 2007 as hedges were unwound with maturing debt and new hedges were not sought to the same extent due to the contraction in debt markets.
The Reserve Bank reduced its holdings of foreign exchange reserves by $23.6b during the December quarter 2007 following the reduction of $28.0b in the September quarter. As stated in the Reserve Bank's February Statement on Monetary Policy "Over the past six months the Bank has wound back its holdings of foreign exchange under swap for two reasons. The first is the significant contraction in the Bank’s balance sheet which occurred over the second half of 2007, as the Future Fund withdrew its deposits. The second reflects a shift in the Bank’s open market operating procedures, as the Bank responded to the global financial turbulence by providing banks in Australia with liquidity through repurchase agreements secured against a wider range of domestic collateral. This shift was designed to ease liquidity pressures in the domestic money market as conditions in global financial markets deteriorated".
The balance on financial account recorded a net inflow of $19.0b, with a $21.4b inflow of debt partly offset by a $2.5b outflow of equity.
Direct investment in Australia recorded an outflow of $7.0b in the December quarter 2007, a turnaround of $32.9b on the revised September quarter 2007 inflow of $26.0b. Australia's direct investment abroad recorded an inflow of $4.0b, a turnaround of $22.5b on the previous quarter's revised outflow of $18.5b. In net terms, direct investment recorded an outflow of $3.0b, a turnaround of $10.4b on the September 2007 inflow of $7.4b.
Portfolio investment recorded a net outflow of $18.6b, an increase of $2.8b on the net outflow of $15.8b in September quarter 2007. This largely reflects the continued significant tightening of global credit markets.
Other investment recorded a net inflow of $28.6b, a turnaround of $30.3b on the net outflow of $1.7b in the previous quarter.
Reserve assets recorded a net inflow of $23.6b, a decrease of $4.5b on the previous quarter's net inflow of $28.1b.
INTERNATIONAL INVESTMENT POSITION
Australia's net international investment position at 31 December 2007 was a net foreign liability of $736.8b, up $53.3b (8%) on 30 September 2007. The increase consisted of:
- price changes of $35.8b
- net transactions of $19.0b
- exchange rate changes of -$1.7b.
During the December quarter 2007 the level of net foreign debt rose by $24.2b (4%) to $610.0b. Net debt raisings were $21.4b, however this reflected significant falls in both foreign debt assets and foreign debt liabilities again due to the fallout of the tightening of global credit markets. Increases due to exchange rate changes of $4.7b and other changes of $1.2b were partially offset by a decrease due to price changes of -$3.2b.
During the December quarter 2007 net foreign equity rose $29.1b (30%) to close at a liability of $126.9b. An increase in price changes of $39.0b was partially offset by net transactions of -$2.5b, exchange rate changes of -$6.5b and other changes of -$1.0b. The large price changes were the result of broad based falls in both the Australian and overseas equity markets during the December quarter 2007.
CALENDAR YEAR 2007 SITUATION
BALANCE OF PAYMENTS
In original terms, the balance on current account for calendar year 2007 was a deficit of $67.4b, a 22% increase on the deficit of $55.0b recorded for 2006. The balance on goods and services deficit was $19.2b, an increase of $7.6b on the deficit of $11.6b recorded in 2006. Goods exports increased $3.6b (2%) due to increases in volumes and prices, and goods imports increased $12.0b (7%) due largely to an increase in volumes.
The 2007 services surplus of $1.9b was an increase of $0.8b on the surplus of $1.2b in 2006.
The 2007 net income deficit rose $4.9b (11%), with an increase in income credits of $6.4b (22%) and an increase in income debits of $11.3b (16%).
The balance on financial account recorded a net inflow of $65.7b, with a net inflow on debt of $95.5b and a net outflow on equity of $29.8b. This result was up $12.4b on the net inflow recorded for the previous year as a result of:
- a decrease of $65.2b on the net inflow on portfolio investment
- a turnaround of $52.7b to a net inflow on reserve assets
- a turnaround of $45.8b to a net inflow on other investment
- a turnaround of $15.4b to a net outflow on financial derivatives
- a turnaround of $5.6b to a net outflow on direct investment.
INTERNATIONAL INVESTMENT POSITION
Australia's net international investment position as at 31 December 2007 was a net foreign liability of $736.8b. This was up $132.4b (22%) on the position a year earlier as a result of:
- net transactions of $65.7b
- price changes of $54.5b
- exchange rate changes of $11.8b
- other adjustments of $0.5b.
During 2007 calendar year, the level of net equity liabilities increased to $126.9b, up $45.0b (55%) on the previous year with price changes of $52.8b, exchange rate changes of $21.7b and other changes of $0.3b. These were partially offset by transactions of -$29.8b.
Net foreign debt rose to $610.0b, up $87.4b (17%) on the previous year, with transactions of $95.5b, price changes of $1.6b and other changes of $0.2b. These were partially offset by exchange rate changes of -$9.9b.
At 31 December 2007, the ratio of Australia's net international investment position to GDP using the latest available GDP figure (for the year ended 30 September 2007 using current prices) was 69.1%. This compares with 60.1% one year ago and 50.3% one decade ago.
 Print Page
 Print All