FEATURE ARTICLE 2: CULTURAL DIVERSITY IN WESTERN AUSTRALIA
INTRODUCTION
Western Australia has a diverse population, comprising people born in a variety of countries and having a range of ethnic, language and religious backgrounds. Throughout Western Australia's history, migration has had a significant impact on the characteristics of the population. As well as contributing to population growth, migration patterns have largely influenced the range of cultures in Western Australia.
The composition of the population is of widespread interest and has implications in policy and planning. This analysis provides some insight into the composition of the usual resident Western Australian population by examining data from the 2006 Census of Population and Housing. Data from the Census are used to highlight characteristics of the population, focusing on birthplace, ancestry, language and religion. Changes over time are considered at a state level and comparisons between Western Australian regions and Australia are made.
BIRTHPLACE
The majority of Western Australians are Australian born. However, many were born in different parts of the world. Birthplace information allows for comparison of people born in Australia and overseas, as well as between different countries of birth.
AUSTRALIAN AND OVERSEAS-BORN RESIDENTS, Western Australia - 2006 |
|  |
 | PERSONS | PROPORTION OF WA RESIDENTS |  |
| Birthplace | no. | % |  |
|  |
| Australia | 1 279 226 | 65.3 |  |
| Overseas | 530 541 | 27.1 |  |
| Not stated or inadequately described(a) | 149 320 | 7.6 |  |
| Total | 1 959 087 | 100.0 |  |
|  |
| (a) Includes persons at sea or not elsewhere classified. |
| 2006 Census of Population and Housing. |
AUSTRALIAN-BORN RESIDENTS
In 2006, nearly two thirds of Western Australian residents reported that they were born in Australia (65% or 1,279,000). This was lower than the national figure (71%) and slightly lower than for Western Australia in 1996 (69%). The proportion of Australian-born residents was higher in regional areas than it was in Perth Statistical Division (SD) (76% compared to 62%). This reflects Perth being the principal settlement destination in Western Australia for overseas-born migrants. One third of people who were born in Australia (34% or 431,600) had at least one parent born overseas, while 13% (172,300) had both of their parents born overseas.
ABORIGINAL AND TORRES STRAIT ISLANDERS
In the 2006 Census, around 3% of Western Australian residents identified as being of Aboriginal or Torres Strait Islander origin, while 90% of residents responded that they were not of Aboriginal or Torres Strait Islander origin. The remaining 7% of Western Australian residents did not state whether or not they were of Aboriginal or Torres Strait Islander origin.
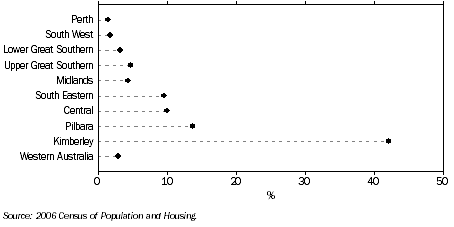
More than one third of the state's Aboriginal or Torres Strait Islander people lived in the Perth SD (36%). However, this group represented only 1.5% of the total Perth SD population. The Kimberley SD had by far the highest proportion of its population who identified as being of Aboriginal or Torres Strait Islander origin (42%). While having only 1.5% of the total Western Australian population, the Kimberley SD had more than one fifth (21%) of the state's Aboriginal and Torres Strait Islander population.
PROPORTION OF WA RESIDENTS IDENTIFIED AS ABORIGINAL OR TORRES STRAIT ISLANDER, By Statistical Division-2006
OVERSEAS-BORN RESIDENTS
Although a large proportion of Western Australian residents were born in Australia, overseas-born residents comprise a significant part of the population. In 2006, 27% (530,500) of Western Australian residents reported that they were born overseas - a similar proportion to 1996 (28%). Western Australia had the highest proportion of overseas-born residents of all states and territories and compares to 22% for Australia. There were slightly more overseas-born females (51% or 269,800) than males (49% or 260,700) in Western Australia in 2006 and almost two thirds of overseas-born Western Australian residents were Australian citizens (66% or 351,400).
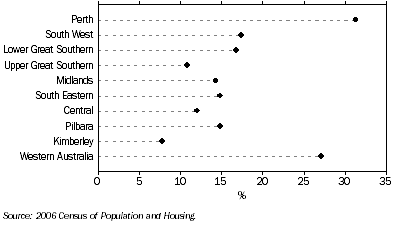
At the Statistical Division level, the Perth SD had the highest proportion of its resident population born overseas (31%) in 2006, followed by the South West SD (17%) and Lower Great Southern SD (17%). The Kimberley SD had the lowest proportion of its population born overseas (7.8%).
PROPORTION OF WA RESIDENTS BORN OVERSEAS, By Statistical Division-2006
Across Local Government Areas (LGAs), Perth (C) had the highest proportion of residents born overseas (44%), followed by Canning (C) (38%), Wanneroo (C) (35%), Joondalup (C) (35%) and Victoria Park (T) (35%). Each of these LGAs were in the Perth SD. Also within the Perth SD, Cottesloe (T) (21%) and Peppermint Grove (S) (22%) had the lowest proportions of overseas-born residents. Outside of the Perth SD, Denmark (S) had the highest proportion of overseas-born residents (24%), while Ngaanyatjarraku (S) and Halls Creek (S) had the lowest proportions (0.7% and 2.6% respectively).
COUNTRY OF BIRTH
Overseas-born people in Western Australia come from almost all countries and every continent apart from Antarctica. The 2006 Census recorded approximately 200 birthplaces for Western Australian residents. In 2006, the top five birthplaces for overseas-born residents in Western Australia were:
- England (174,200 people or 33% of overseas-born residents);
- New Zealand (47,300 or 8.9%);
- Scotland (24,400 or 4.6%);
- South Africa (22,000 or 4.2%); and
- Italy (20,900 or 3.9%).
England and New Zealand were also the most frequently reported birthplaces for Western Australian residents in 1996, then comprising 36% and 8.2% of overseas-born residents respectively.
Across the nation, England was the top birthplace accounting for 19% of overseas-born residents in 2006, well ahead of New Zealand (8.8%), China (4.7%), Italy (4.5%) and Viet Nam (3.6%). In contrast, Viet Nam and China were ranked ninth (2.0%) and thirteenth (1.5%) in Western Australia.
MOST FREQUENTLY REPORTED BIRTHPLACES, Western Australian residents born overseas |
|  |
 |  | 1996 |  |  | 2006 |  |
 |  | PERSONS | PROPORTION OF
OVERSEAS BORN
WA RESIDENTS |  |  | PERSONS | PROPORTION OF
OVERSEAS BORN
WA RESIDENTS | AUSTRALIA
RANK |  |
| Rank |  | no. | % |  |  | no. | % |  |  |
|  |
| 1 | England | 170 596 | 35.9 |  | England | 174 190 | 32.8 | 1 |  |
| 2 | New Zealand | 38 917 | 8.2 |  | New Zealand | 47 331 | 8.9 | 2 |  |
| 3 | Italy | 25 113 | 5.3 |  | Scotland | 24 418 | 4.6 | 7 |  |
| 4 | Scotland | 24 877 | 5.2 |  | South Africa | 22 050 | 4.2 | 11 |  |
| 5 | Malaysia | 17 355 | 3.7 |  | Italy | 20 937 | 3.9 | 4 |  |
| 6 | India | 12 668 | 2.7 |  | Malaysia | 19 718 | 3.7 | 12 |  |
| 7 | Netherlands | 11 000 | 2.3 |  | India | 15 155 | 2.9 | 6 |  |
| 8 | South Africa | 10 702 | 2.3 |  | Singapore | 11 811 | 2.2 | 26 |  |
| 9 | Viet Nam | 10 080 | 2.1 |  | Viet Nam | 10 489 | 2.0 | 5 |  |
| 10 | Germany | 9 955 | 2.1 |  | Netherlands | 10 108 | 1.9 | 13 |  |
| 11 | Singapore | 9 469 | 2.0 |  | Germany | 9 895 | 1.9 | 10 |  |
| 12 | Ireland | 9 395 | 2.0 |  | Ireland | 9 011 | 1.7 | 22 |  |
| 13 | Poland | 6 984 | 1.5 |  | China | 8 004 | 1.5 | 3 |  |
| 14 | Indonesia | 6 076 | 1.3 |  | Indonesia | 7 884 | 1.5 | 21 |  |
| 15 | Burma | 5 587 | 1.2 |  | Philippines | 6 832 | 1.3 | 8 |  |
|  |
| 1996 and 2006 Census of Population and Housing. |
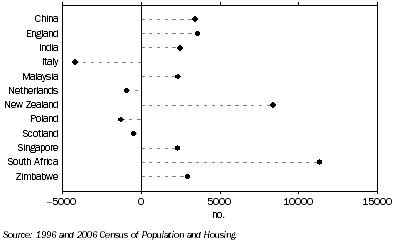
Between 1996-2006, the largest increases in the number of overseas-born people in Western Australia were from South Africa (11,300), New Zealand (8,400), England (3,600), China (3,400) and Zimbabwe (3,000). Italy had the largest decrease of 4,200 people.
CHANGE IN BIRTHPLACE OF WA RESIDENTS, By selected country: 1996 to 2006
YEAR OF ARRIVAL
Changes have occurred in the origin of people migrating to Western Australia over time. Following the Second World War, many European born people came to Western Australia, while in more recent times, many migrants have come from places closer to Australia in the Asia-Pacific region and Africa.
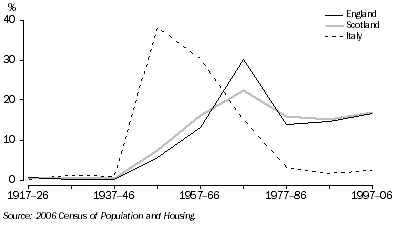
The majority of Italian-born residents in Western Australia in 2006 had arrived in Australia in the years following the Second World War. More than one third (38% or 8,000) arrived between 1947-1956 and a further 30% (6,300) arrived between 1957-1966. Only 7.5% (1,600) of Italian-born residents arrived after 1977. (Note that 6.5% of Italian-born residents did not state their year of arrival).
Nearly one third (30% or 52,500) of English-born residents in Western Australia in 2006 arrived in the decade 1967-1976. By comparison, only 14% (24,200) arrived between 1977-1986. Arrivals of English-born residents increased from 1987 onwards, but not at their former levels.
Just over two fifths (22% or 5,400) of Scottish-born residents in Western Australia in 2006 arrived in the period 1967-1976. Results were lower in the following two decades of 1977-1986 (16% or 3,900) and 1987-1996 (15% or 3,700). However, the proportion of Scottish-born residents arriving between 1997-2006 was slightly higher than in the preceding two decades (17% or 4,100).
YEAR OF ARRIVAL OF WA RESIDENTS, By selected country of birth-2006
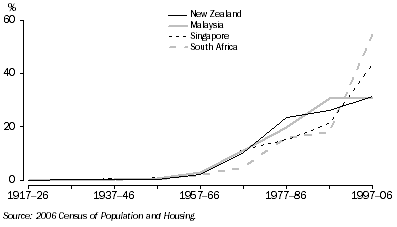
In contrast, more than half (54% or 12,000) of South African-born residents of Western Australia arrived in Australia between 1997-2006. The vast majority of all South African-born residents (89%) stated that they arrived in 1977 or later (4.0% did not state their year of arrival). Similarly, most residents born in Malaysia (81%), New Zealand (81%) and Singapore (80%) stated that they arrived in Australia from 1977 onwards (around 5% of people from these countries did not state their year of arrival).
YEAR OF ARRIVAL OF WA RESIDENTS, By selected country of birth-2006
RECENT ARRIVALS
The most frequently reported birthplaces for Western Australian residents who arrived in Australia between 2001-2006 differed from those of people who arrived earlier. The largest proportions of residents who arrived between 2001-2006 were born in North-West Europe (32%), South East Asia (17%) and Sub-Saharan Africa (17%). The top five countries of birth for people who arrived between 2001-2006 were:
- England (21,300 or 23% of people);
- New Zealand (8,500 or 9.2%);
- South Africa (8,000 or 8.5%);
- Malaysia (4,700 or 5.0%); and
- Singapore (3,800 or 4.1%).
Scotland and Italy, which had the third and fifth largest number of overseas-born residents in Western Australia in 2006, were ranked eighth and thirty fifth in terms of arrivals between 2001-2006.
MEDIAN AGE
Migration patterns over time have contributed to large variations in the median ages of overseas-born Western Australian residents. In 2006, the median age of Australian-born people in Western Australia was 30 years. It was much lower for Indigenous than non-Indigenous residents (21 compared to 37 years). The median age of overseas-born residents was much higher (46 years).
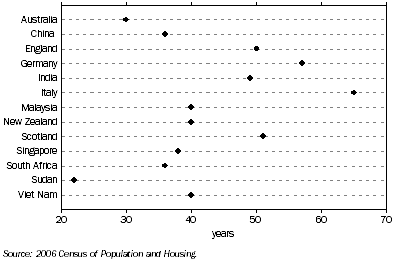
Western Australian residents born in Italy had a median age of 65 years in 2006, which was amongst the highest of all countries. This reflects the fact that most Italian-born residents arrived in Australia more than thirty years ago. By comparison, more recent arrivals generally had lower median ages. For example, the median ages of migrants from South Africa and Singapore were 36 and 38 years respectively. Western Australian residents born in Sudan had one of the lowest median ages of 22 years. The majority (91%) of the 2,000 residents born in Sudan stated that they arrived in Australia after 1991, with 78% arriving after 2001. (Note that 5.7% did not state their year of arrival).
MEDIAN AGE OF WA RESIDENTS, By selected birthplace-2006
AUSTRALIAN AND OVERSEAS-BORN RESIDENTS - SELECTED CHARACTERISTICS
Census data highlights differences across a range of characteristics between overseas-born and Australian-born Western Australian residents. In 2006, overseas-born residents were more likely than Australian-born residents to:
- have completed year 12 or its equivalent level of schooling (50% compared to 30%);
- be married (56% compared to 33%);
- have had children (35% compared to 24% of women aged 15 years or over);
- have cared for children without pay in the two weeks prior to Census night (27% compared to 22%);
- either have undertaken no hours of unpaid domestic work (20% compared to 15%) or 30 hours or more (12% compared to 9.4%) in the week prior to Census night;
- be out of the labour force (37% compared to 30% of people aged 15 years and over); and
- fully own their home (31% compared to 25%).
By comparison, Australian-born residents were more likely to:
- have a mortgage (44% compared to 38%); and
- be employed (66% compared to 59% of people aged 15 years and over).
These differences in employment status and home ownership can largely be explained by the older age structure of overseas-born residents of Western Australia.
ANCESTRY
A person's birthplace alone is a limited indicator of their cultural or ethnic background as it does not reflect birthplaces of previous generations. Ancestry information, however, provides an indication of the background of Australians across generations. Respondents could report up to two ancestries in response to the Census question. Ancestry was collected for the first time in 2001 and the top five ancestries were the same in 2001 and 2006. In 2006, the top five ancestries for Western Australian residents were:
- English (731,000 people);
- Australians (718,900);
- Irish (155,200);
- Scottish (153,600); and
- Italian (102,000).
In 2006, nearly three quarters of residents with Irish and Italian ancestry (both 74%) were born in Australia. The proportions of residents with Scottish or English ancestry who were born in Australia were slightly lower (69% and 68% respectively). Across the Statistical Divisions of Western Australia, Lower Great Southern SD and South West SD had the highest proportions of residents with English ancestry (both with 43%). The Kimberley SD had the highest proportion of its population with Australian ancestry (59%), reflecting the region's high proportion of Indigenous residents. In contrast, Perth SD had the lowest proportion of residents with Australian ancestry (33%).
LANGUAGE
Diversity of birthplaces and ancestries is associated with a large range of languages. The 2006 Census recorded that just under 300 languages were spoken in homes in Western Australia and almost 400 across Australia.
PEOPLE WHO SPOKE ONLY ENGLISH
In 2006, 82% (1,603,000) of Western Australian residents stated that they spoke only English at home, compared to 78% for Australia. The proportion of Western Australians who spoke only English at home had decreased from 86% in 1996.
Three quarters of residents who spoke only English at home were born in Australia (75% or 1,205,000). Australian-born residents were much more likely than overseas-born residents to speak only English at home (94% compared to 69%). In 2006, the proportion of residents who spoke only English at home was higher in regional areas than in Perth (87% compared to 80%).
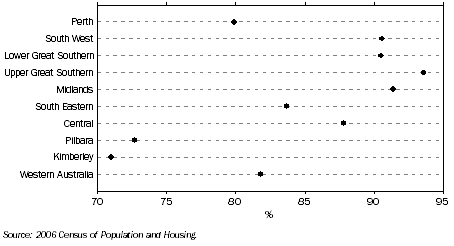
Across Statistical Divisions, Upper Great Southern SD had the highest proportion of residents who spoke only English at home (94%). Kimberley SD had the lowest proportion (71%) with 3,600 residents (12%) speaking an Australian Indigenous language. The Kimberley SD also had a high proportion of residents who did not state their language (14% compared to 7% for Western Australia).
PROPORTION OF WA RESIDENTS WHO SPOKE ONLY ENGLISH AT HOME, By Statistical Division-2006
PEOPLE WHO SPOKE ANOTHER LANGUAGE
In 2006, 222,100 (11%) Western Australian residents stated that they spoke a language other than English at home. The most frequently reported of these languages were:
- Italian (32,900 people);
- Mandarin (16,600);
- Cantonese (16,000);
- Vietnamese (13,200); and
- Arabic (7,700).
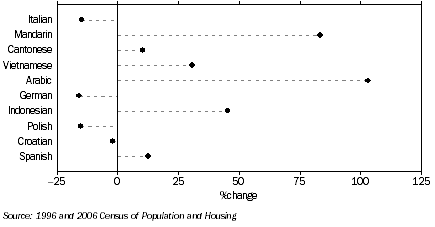
Apart from Arabic, these languages were also in the top five in 1996 (Arabic was then ranked sixteenth). The number of Arabic speakers more than doubled between 1996-2006 (up 3,900 people or 103%). Between 1996-2006, the number of Western Australian residents born in Iraq (1,100), Somalia (500) and Ethiopia (400) showed the largest increase among Arabic speaking nations.
Mandarin speakers had the largest increase between 1996-2006 (up 7,500 people or 83%). Numbers of Vietnamese and Cantonese speakers also increased by 3,100 and 1,500 people respectively. In contrast, the number of Italian speakers declined by 5,700 people (15%) in the ten year period to 2006. German was the fifth ranked language spoken in 1996, but recorded a fall in the number of speakers of 1,300 people (16%) between 1996-2006.
CHANGE IN NUMBER OF SPEAKERS FROM 1996 TO 2006, Top 10 languages spoken by WA residents (2006)
More than two fifths (42%) of people who spoke Italian at home stated that they were born in Australia. This partially reflects second and third generations speaking the language. Other languages with high proportions of Australian-born speakers were Croatian (32%) and Vietnamese (29%). In contrast, lower proportions of people who spoke Mandarin (12%) and Indonesian (14%) at home stated that they were born in Australia.
The majority of Mandarin (97%), Cantonese (97%), Arabic (97%), Vietnamese (96%) and Italian (90%) speakers resided in Perth, while among Statistical Divisions, South West SD had the largest number of Italian speakers outside of the Perth SD (2,100 or 6.4% of Italian speakers).
PROFICIENCY IN SPOKEN ENGLISH
Although people may communicate in more than one language, a person's proficiency in spoken English is an indicator of their ability to share information, to interact with and relate to others in Australia. This is important for their full participation and sense of belonging in the wider community. Those who are not proficient may be disadvantaged in many areas, including employment prospects and social interaction.
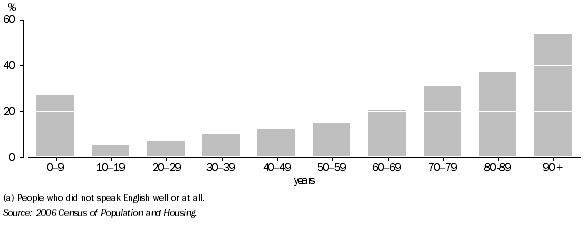
Census data provides information on a person's self-assessed proficiency in spoken English. In 2006, more than four fifths (83%) of all people who spoke a language other than English reported that they spoke English either well or very well; 12% did not speak English well and 2.9% did not speak English at all. The remaining 1.9% did not state their proficiency in spoken English.
Generally, the likelihood of not having proficiency in spoken English increased with age. The proportion of people aged 65 years or over, who did not speak English well or at all, was much higher than across all ages (31% compared to 15%).
PROPORTION OF WA RESIDENTS WHO SPOKE A LANGUAGE OTHER THAN ENGLISH & WERE NOT PROFICIENT IN ENGLISH(a), By age group-2006
RELIGION
Western Australia also has a diverse range of religions and its religious profile is changing. A question on religious denomination has been included in all Australian Censuses, although this question has always been optional.
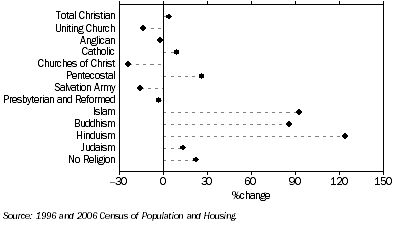
CHANGE IN RELIGIOUS AFFILIATIONS OF WA RESIDENTS, By selected religion: 1996 to 2006
CHRISTIAN RELIGIONS
Christianity has remained the dominant religion in Western Australia. In 2006, more than half (59% or 1,163,000) of all Western Australian residents reported that they were Christian. This compares to 64% nationally and was the second lowest proportion of all states and territories. Only the Northern Territory had a lower proportion (55%).
Despite the number of Western Australian residents who were Christian increasing by 43,100 people between 1996-2006, the proportion of the population decreased from 66% to 59%. In 2006, a higher proportion of Christians was female than male (53% compared to 47% respectively). The proportion of Christian residents was similar for Perth and rest of the state (60% and 58% respectively). Across Statistical Divisions, Upper Great Southern SD had the highest proportion of residents who were Christian (66%), while the Pilbara SD had the lowest (45%). The Pilbara SD had the highest proportion of people who did not state their religion (24% compared to 14% statewide).
CHRISTIAN DENOMINATIONS
In 2006, the most frequently reported Christian denominations in Western Australia were Catholic (464,000 people or 24%) and Anglican (400,500 people or 20%). Kimberley SD had the highest proportion of residents who stated that they were Catholic (28%) and nearly half (49%) of them lived in the Shire of Broome. In contrast, the Lower Great Southern SD had the lowest proportion of people reporting to be Catholic (14%). Upper Great Southern SD (27%) and Midlands SD (27%) had the highest proportions of residents who were Anglican. Kimberley SD had the lowest proportion of Anglican residents (10%).
From 1996 to 2006, Catholicism had the largest increase in numbers (up 37,700 people or 8.9%). The Uniting Church (11,900 people or 14%) and Anglican (8,000 or 2.0%) religions recorded the largest decreases. The fastest growing Christian denomination was Pentecostal, which increased 26% (3,700 people). Churches of Christ had the fastest decline of 24% (3,100 people).
NON-CHRISTIAN RELIGIONS
In 2006, the most frequently reported non-Christian religious affiliations in Western Australia were Buddhism (34,400 people or 1.8%), Islam (24,200 people or 1.2%) and Hinduism (8,200 people or 0.4%). More females than males stated Buddhism as their religion (53% compared to 47%). The majority of people with non-Christian religions were residents of Perth SD (93% of Hindu, 92% Islam and 91% of Buddhist religions respectively).
Between 1996-2006, there was considerable growth in non-Christian religions in Western Australia. Buddhism had the largest growth in numbers (15,800 people or 86%). Islam increased by 11,600 people with a much higher growth rate for Western Australia than Australia (92% compared to 69%). Hinduism had the fastest growth rate of all religions, increasing 124% (4,500 people).
NO RELIGION
In 2006, 23% (448,400) of Western Australian residents stated that they had no religion. This proportion was higher than for Australia (19%) and compares to 22% (366,800 people) for Western Australia in 1996. A higher proportion of people who reported no religion were male than female (54% compared to 46%). People born in Australia were more likely than those born overseas to have no religion (27% compared to 18%). The proportion of residents with no religion was highest in the Lower Great Southern SD (28%). Kimberley SD had the lowest proportion (21%).
SUMMARY
Western Australia has a multicultural population, with the highest proportion of overseas-born residents of all states and territories. A higher proportion of overseas-born people reside in Perth compared to regional areas.
England and New Zealand were the most common countries of birth for Western Australian residents in both 1996 and 2006. Over the ten year period, Italy had the largest decline in numbers of people. It has one of the oldest populations with relatively few migrants arriving in the last 30 years. Residents from South Africa and New Zealand had the largest increases in numbers in the ten year period.
Apart from English, Italian remains the most widely spoken language in Western Australia, although the number of speakers declined between 1996-2006. Mandarin had the largest increase in the number of speakers, while Arabic was proportionally the fastest growing language.
Christianity has remained the dominant religion, however, the proportion of Christians has decreased. Catholicism and Buddhism had the largest increases in numbers. Growth rates for non-Christian religions were faster than for Christian religions and Hinduism had the fastest growth rate of all religions. Most people reporting non-Christian religions lived in Perth.
Over time the combination of birthplaces, ancestries, languages and religions has changed. The social, political and economic environment both in Australia and overseas is constantly changing, and this could continue to alter Western Australia's population characteristics.
 Print Page
 Print All