STAGE OF PRODUCTION COMMENTARY
STAGE OF PRODUCTION (SOP) OVERVIEW
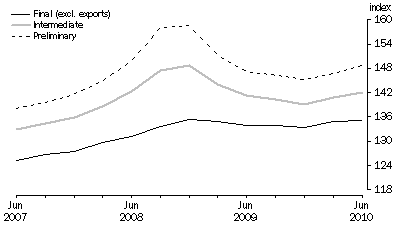
In June quarter 2010, the final (Stage 3) index recorded an increase of 0.3%, the intermediate (Stage 2) index recorded an increase of 0.9% and the preliminary (Stage 1) index recorded an increase of 1.5%. Through the year to June quarter 2010, the final (Stage 3) index increased by 1.0%, the intermediate (Stage 2) index increased by 0.6% and the preliminary (Stage 1) index increased by 1.2%.
The increase of 0.3% in the final (Stage 3) index reflected a rise of 0.4% in the price of domestically produced items and a fall of 0.1% in the price of imported items. The domestic component recorded price rises for building construction (+0.3%), real estate agents (+3.3%) and tobacco product manufacturing (+8.0%). Partly offsetting these rises were decreases in the prices of meat and meat product manufacturing (-4.3%) and accommodation (-5.4%). The imports component decreased due to price falls for motor vehicle and part manufacturing (-2.8%), industrial machinery and equipment manufacturing (-2.0%) and fruit and vegetable processing (-9.3%). Partly offsetting these falls were increases in the prices of dairy product manufacturing (+35.2%), photographic and scientific equipment manufacturing (+6.4%) and other food manufacturing (+2.5%).
The increase of 0.9% in the intermediate (Stage 2) index reflected a rise of 0.7% in the price of domestically produced items and a rise of 2.5% in the price of imported items. The domestic component recorded price rises for electricity, gas and water supply (+3.9%), metal ore mining (+4.4%) and grain, sheep, beef and dairy cattle farming (+1.9%). Partly offsetting these rises were decreases in the prices of structural metal product manufacturing (-7.2%) and meat and meat product manufacturing (-7.5%). The imports component increased due to price rises in basic chemical manufacturing (+16.2%), oil and gas extraction (+5.3%) and dairy product manufacturing (+35.2%). Partly offsetting these rises were decreases in the prices of petroleum refining (-5.2%) and non-metallic mineral product manufacturing (-4.4%).
The increase of 1.5% in the preliminary (Stage 1) index reflected a rise of 1.1% in the price of domestically produced items and a rise of 3.9% in the price of imported items. The domestic component recorded price rises for metal ore mining (+15.0%), electricity, gas and water supply (+3.6%) and property operators and developers (+0.9%). Partly offsetting these rises were decreases in the prices of structural metal product manufacturing (-7.2%) and meat and meat product manufacturing (-7.5%). The imports component increased due to price rises in basic chemical manufacturing (+16.2%), oil and gas extraction (+5.3%) and metal ore mining (+10.6%). Partly offsetting these rises were decreases in the prices of petroleum refining (-6.1%) and industrial machinery and equipment manufacturing (-1.0%).
COMPARISON OF SOP INDEXES: Base: 1998-99 = 100.0

WHERE TO FIND ADDITIONAL COMMENTARY
Additional commentary for Producer Price Indexes is available in the entry for
Producer Price Indexes, Australia (cat. no. 6427.0) on the ABS website <
https://www.abs.gov.au>.
The additional commentary includes:
- Manufacturing industries producer price indexes
- Materials used in manufacturing industries
- Articles produced by manufacturing industries
- Construction industries producer price indexes
- Materials used in house building
- Output of the construction industry
- Service industries producer price indexes
 Print Page
 Print All