VICTORIA
Victoria is the second largest state in Australia in terms of GSP. In 2005-06 it represented around a quarter of Australian GDP in level terms.
Gross state product, Victoria - Chain volume measures(a) |
|  |
 | 2000-01 | 2001-02 | 2002-03 | 2003-04 | 2004-05 | 2005-06 |  |
Values ($m) |  |
|  |
| GSP(A) | 194 937 | 202 079 | 208 277 | 217 263 | 221 804 | 227 149 |  |
| GSP(P) | 196 633 | 203 149 | 210 270 | 217 421 | 221 386 | 226 100 |  |
| GSP(I/E) | 193 241 | 201 010 | 206 283 | 217 105 | 222 221 | 228 198 |  |
| GDP | 784 017 | 813 542 | 839 187 | 873 197 | 896 568 | 921 747 |  |
Percentage changes from previous year (%) |  |
|  |
| GSP(A) | 0.9 | 3.7 | 3.1 | 4.3 | 2.1 | 2.4 |  |
| GSP(P) | 0.2 | 3.3 | 3.5 | 3.4 | 1.8 | 2.1 |  |
| GSP(I/E) | 1.5 | 4.0 | 2.6 | 5.2 | 2.4 | 2.7 |  |
|  |
| (a) Reference year for chain volume measures is 2004-05. |
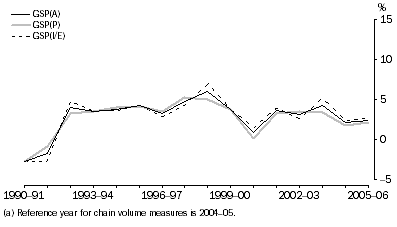
Gross State Product, Victoria
- Chain volume measures(a)
: Percentage changes from previous year

The first two years of the time series saw negative growth in GSP(P) for Victoria. All years following had positive, and mostly strong growth.
As can be seen from the graph, growth in GSP(P) and GSP(I/E) are close throughout the time series except for 1998-99 and 2003-04.
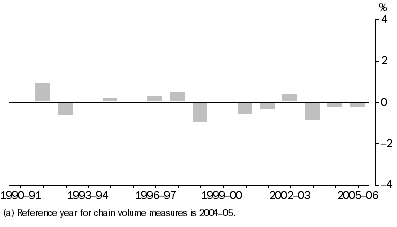
Difference between GSP(A) and GSP(I/E), Percentage changes
- Victoria
: Chain volume measures(a)

Throughout the time series, the difference between GSP(A) and GSP(I/E) growth has been less than 1.0 percentage point.
GSP, Victoria - Chain volume measures(a): Contribution to growth |
|  |
 | 2000-01 | 2001-02 | 2002-03 | 2003-04 | 2004-05 | 2005-06 |  |
 | % pts | % pts | % pts | % pts | % pts | % pts |  |
|  |
| Agriculture, forestry & fishing | 0.2 | 0.1 | -0.7 | 0.7 | -0.1 | 0.1 |  |
| Mining | -0.2 | - | -0.2 | - | -0.2 | -0.1 |  |
| Manufacturing | -0.1 | -0.1 | 0.2 | -0.2 | -0.5 | -0.4 |  |
| Electricity, gas & water supply | -0.1 | - | 0.1 | - | - | -0.1 |  |
| Construction | -0.7 | 0.6 | 0.7 | 0.4 | 0.2 | 0.3 |  |
| Wholesale trade | -0.3 | - | 0.7 | 0.6 | 0.1 | -0.1 |  |
| Retail trade | 0.1 | 0.4 | 0.3 | 0.3 | 0.3 | - |  |
| Accommodation, cafes & restaurants | - | 0.1 | - | 0.2 | 0.1 | - |  |
| Transport & storage | 0.3 | 0.1 | 0.4 | 0.1 | 0.3 | 0.1 |  |
| Communication services | - | 0.1 | 0.3 | 0.2 | 0.1 | 0.2 |  |
| Finance & insurance | - | 0.3 | 0.2 | 0.3 | 0.1 | 0.3 |  |
| Property & business services | 0.1 | 0.5 | 0.3 | -0.1 | 0.1 | 0.6 |  |
| Government administration & defence | 0.2 | 0.3 | - | - | - | - |  |
| Education | 0.1 | 0.1 | 0.1 | 0.1 | 0.1 | 0.1 |  |
| Health & community services | 0.2 | 0.3 | 0.4 | 0.2 | 0.3 | 0.3 |  |
| Cultural & recreational services | 0.1 | 0.1 | - | 0.1 | 0.1 | 0.1 |  |
| Personal & other services | 0.1 | 0.1 | - | - | 0.1 | 0.2 |  |
| Ownership of dwellings | 0.3 | 0.3 | 0.3 | 0.3 | 0.3 | 0.3 |  |
| Taxes less subsidies on products | -0.2 | 0.4 | 0.6 | 0.3 | 0.3 | 0.2 |  |
| Statistical discrepancy | 0.6 | 0.3 | -0.5 | 0.9 | 0.3 | 0.2 |  |
| GSP(A) | 0.9 | 3.7 | 3.1 | 4.3 | 2.1 | 2.4 |  |
|  |
| - nil or rounded to zero (including null cells) |
| (a) Reference year for chain volume measures is 2004-05. |
In 2005-06 the main industries that contributed to Victorian GSP growth were Property and business services (0.6 percentage points), Construction, Finance and insurance, Health and community services and Ownership of dwellings (each 0.3 percentage points). The main negative contributing industry in 2005-06 was Manufacturing (-0.4 percentage points).
 Print Page
 Print All