ANALYSIS AND COMMENTS
BALANCE OF PAYMENTS
CURRENT ACCOUNT
The trend estimate of the balance on current account for the June quarter 2007 was a deficit of $16,231m, an increase of $671m (4%) on the deficit recorded for the March quarter 2007 where:
- the goods and services deficit rose $514m (15%) to $4,008m
- the income deficit rose $164m (1%) to $12,123m
- the current transfers deficit fell $6m (6%) to $101m.
In seasonally adjusted terms, the current account deficit rose $453m (3%) to $15,998m between the March quarter 2007 and June quarter 2007 where:
- the goods and services deficit rose $264m (7%) to $3,798m
- the income deficit rose $180m (2%) to $12,094m
- the current transfers deficit rose $9m (9%) to $106m.
Goods and Services
The trend estimate of the balance on goods and services at current prices was a deficit of $4,008m, an increase of $514m (15%) on the March quarter 2007 deficit.
In seasonally adjusted terms, the balance on goods and services was a deficit of $3,798m, an increase of $264m (7%) on the March quarter 2007 deficit where:
- the net goods deficit rose $163m (4%) to $4,252m
- the net services surplus fell $101m (18%) to $454m.
The increase in the goods deficit resulted from higher goods debits (imports), up $290m (1%), partly offset by higher goods credits (exports), up $127m.
The increase in goods debits was driven by:
- intermediate and other merchandise goods, up $387m (2%)
- other goods, up $184m (10%)
- capital goods, up $55m (1%)
- partly offset by consumption goods debits, down $336m (2%).
The increase in goods credits was driven by the other goods credits component, up $471m (15%), partly offset by:
- rural goods, down $317m (5%)
- non-rural goods, down $26m.
The decrease in the services surplus resulted from higher services debits, up $239m (2%), partly offset by higher services credits, up $138m (1%).
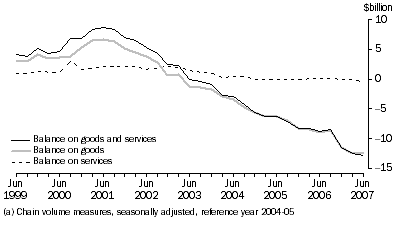
In seasonally adjusted volume terms, the deficit on goods and services was $12,867m, an increase of $292m (2%) on the $12,575m deficit recorded in the March quarter 2007. The net deficit on goods fell $99m (1%) to $12,421m. Goods credits rose $311m (1%) and goods debits rose $212m. The net services balance was a deficit of $445m, an increase of $389m on the deficit of $56m in March quarter 2007.
The increase of $292m in the deficit on goods and services in volume terms could be expected to contribute -0.1 percentage points to growth in the June quarter 2007 volume measures of GDP, assuming no significant revision to the GDP chain volume estimate for the March quarter 2007.
Goods and Services(a)
Goods Credits
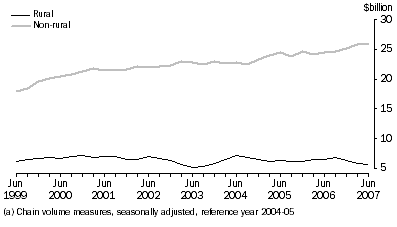
The trend estimate of goods credits rose $139m to $42,615m in the June quarter 2007.
In seasonally adjusted current price terms, goods credits rose $127m to $42,656m.
Exports of rural goods, in seasonally adjusted terms at current prices, fell $317m (5%) to $5,813m, with volumes down 2% and prices down 4%. The decreases were in:
- meat and meat preparations, down $253m (14%), with volumes down 8% and prices down 7%
- other rural, down $48m (2%), with volumes up 3% and prices down 5%
- cereal grains and cereal preparations, down $43m (5%), with volumes down 7% and prices up 1%.
Partly offsetting these decreases was the wool and sheepskins component, up $27m (3%), with volumes up 2% and prices up 1%.
Exports of non-rural goods, in seasonally adjusted terms at current prices, fell $26m to $33,283m. The largest decreases were in:
- metals (excluding non-monetary gold), down $259m (7%), with volumes down 9% and prices up 3%
- other manufactures, down $250m (6%), on decreased volumes
- coal, coke and briquettes, down $163m (3%), with volumes up 3% and prices down 6%
- metal ores and minerals, down $94m (1%), with volumes down 4% and prices up 3%.
Largely offsetting these decreases were rises in:
- other non-rural (including sugar and beverages), up $452m (12%), with volumes up 8% and prices up 4%
- other mineral fuels, up $198m (5%), on increased volumes
- machinery, up $63m (3%), with volumes up 8% and prices down 4%.
Exports of other goods, in seasonally adjusted terms at current prices, rose $471m (15%) to $3,561m. The main contributor to this increase was the non-monetary gold component, up $482m (18%), with volumes up 21% and prices down 2%.
General Merchandise Credits(a)
Goods Debits
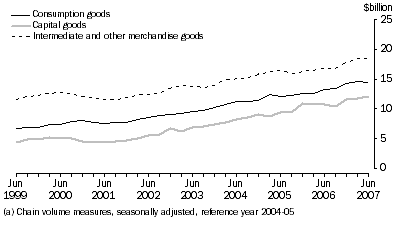
The trend estimate of goods debits rose $691m (1%) to $47,140m in the June quarter 2007.
In seasonally adjusted current price terms, goods debits rose $290m (1%) to $46,908m.
Imports of consumption goods, in seasonally adjusted terms at current prices, fell $336m (2%) to $13,821m, with volumes down 1% and prices down 2%. The largest decreases were in:
- non-industrial transport equipment, down $183m (5%), largely on decreased volumes
- food and beverages, mainly for consumption, down $181m (9%), with volumes down 6% and prices down 3%
- textiles, clothing and footwear, down $57m (3%), largely on decreased prices.
Partly offsetting these decreases were rises in:
- consumption goods n.e.s., up $77m (2%), with both volumes and prices up 1%
- household electrical items, up $21m (2%), with volumes up 7% and prices down 5%.
Imports of capital goods, in seasonally adjusted terms at current prices, rose $55m (1%) to $10,560m, with volumes up 3% and prices down 2%. The increases were in:
- civil aircraft, up $616m, largely on increased volumes
- telecommunications equipment, up $141m (11%), with volumes up 16% and prices down 4%.
Largely offsetting these increases were falls in:
- industrial transport equipment n.e.s., down $312m (16%), with volumes down 15% and prices down 1%
- machinery and industrial equipment, down $166m (4%), with volumes down 3% and prices down 1%
- ADP equipment, down $163m (9%), with volumes down 1% and prices down 8%.
Imports of intermediate and other merchandise goods, in seasonally adjusted terms at current prices, rose $387m (2%) to $20,537m, with volumes down 1% and prices up 3%. The main contributor to this increase was in the fuels and lubricants component, up $888m (18%), with volumes up 4% and prices up 14%.
Partly offsetting this increase were falls in:
- other parts for capital goods, down $144m (5%), with volumes down 2% and prices down 3%
- organic and inorganic chemicals, down $121m (10%), with volumes down 16% and prices up 6%
- other merchandise goods, down $76m (17%), largely on decreased volumes
- iron and steel, down $67m (6%), with volumes down 4% and prices down 3%
- parts for transport equipment, down $66m (3%), largely on decreased prices.
Imports of other goods, in seasonally adjusted terms at current prices, rose $184m (10%) to $1,990m, driven by a rise in the non-monetary gold component, up $363m (29%), with volumes up 33% and prices down 3%, partly offset by a fall in the goods for processing component, down $188m (98%), largely on decreased volumes.
General Merchandise Debits(a)
Services
The trend estimate of net services at current prices was a surplus of $517m, an increase of $38m (8%) on the March quarter 2007 surplus of $479m.
In seasonally adjusted current price terms, net services recorded a surplus of $454m, a decrease of $101m (18%) on the March quarter 2007 surplus of $555m.
Services credits, in seasonally adjusted terms at current prices, rose $138m (1%) to $11,936m, with both volumes and prices rising marginally. The components that contributed to the rise in the seasonally adjusted series were:
- travel services, up $105m (2%), with both volumes and prices up 1%
- transportation services, up $39m (2%), on increased volumes.
Partly offsetting these increases was a fall in the other services component, down $5m, with volumes down 1% and prices up 1%.
Services debits, in seasonally adjusted terms at current prices, rose $239m (2%) to $11,482m, with volumes up 4% and prices down 2%. All components contributed to the rise in the seasonally adjusted series with:
- travel services, up $143m (4%), with volumes up 6% and prices down 2%
- other services, up $85m (3%), with volumes up 6% and prices down 3%
- transportation services, up $11m.
Seasonally adjusted, tourism related services credits rose $110m (1%) to $7,683m, while tourism related services debits rose $194m (3%) to $6,000m.
IMPLICIT PRICE DEFLATOR
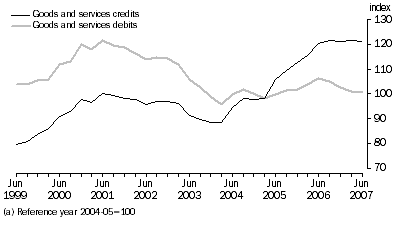
In seasonally adjusted terms, the implicit price deflator (IPD) for total goods and services credits fell 0.3%. In original terms, it fell by 0.1%. The chain Laspeyres price index for goods and services credits remained unchanged, indicating that the compositional effects had a small downward influence on the movement in the IPD. In original terms, the IPD for goods credits fell 0.8% while the IPD for services credits rose 0.8%.
The total goods and services debits IPD fell 0.2% in seasonally adjusted terms. In original terms, it fell by 0.6% and the chain Laspeyres price index for goods and services debits fell 0.1%. In original terms, the IPD for goods debits fell 0.4% and the IPD for services debits fell 1.5%.
IMPLICIT PRICE DEFLATOR(a)
Relationship to IPI and EPI
In original terms, the implicit price deflator for total goods credits fell 0.8% while the chain Laspeyres price index for goods exports rose 0.2%. The export price index (EPI) rose 0.3% during the June quarter 2007.
In original terms, the implicit price deflator for total goods debits fell 0.4% while the chain Laspeyres price index for goods imports rose 0.2%. The import price index (IPI) rose 0.1% during the June quarter 2007.
Terms of trade
Australia's seasonally adjusted terms of trade fell 0.1% to 120.2, with a decrease of 0.3% in the IPD for goods and services credits and also a 0.2% decrease in the goods and services debits IPD. The trend estimate of the terms of trade increased 1.0% to 121.0.
Income
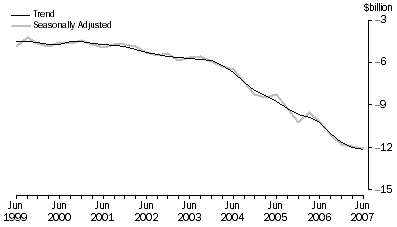
The trend estimate of the net income deficit increased $164m (1%) to $12,123m.
In seasonally adjusted terms the net income deficit rose $180m (2%) to $12,094m. Investment income credits and debits increased by a similar amount ( $844m (11%) and $872m (4%), respectively) resulting in the deficit in net investment income falling $12m. Compensation of employees credits decreased by $76m ( 18%) while debits increased by $116m (12%). The March quarter 2007 compensation of employees debits, in original terms, has been revised and shows strong growth in the quarter. This should be taken into consideration when analysing the seasonally adjusted series.
In original terms the net income deficit declined $765m (6%) to $11,122m. Income credits rose $1,167m (14%) to $9,691m mainly due to both an increase in profits accruing on direct investment equity held abroad of $529m (11%) and an increase in dividends received on portfolio equity held abroad of $442m (76%).
Income debits rose $402m (2%) to $20,813m due to both an increase in profits accruing to non-residents holding direct equity in Australia of $970m (12%) and an increase in income accruing on portfolio debt held by non-residents of $488m (7%). This was offset by a $982m (38%) decrease in portfolio investment equity dividend payments by residents to non-residents which is highly seasonal.
Net Income
Current Transfers
In seasonally adjusted terms, the net current transfers deficit was $106m, an increase of $9m (9%) on the $97m deficit recorded in the March quarter 2007. Current transfer credits rose $1m and current transfer debits rose $10m (1%).
CAPITAL AND FINANCIAL ACCOUNT
Capital Account
In original terms, the capital account surplus was $356m, down $92m (21%) on the revised March quarter 2007 surplus. Capital transfer credits fell $121m (15%) to $700m and capital transfer debits fell $56m (14%) to $344m.
Financial Account
In original terms, the balance on financial account recorded a net inflow of $13.6b, with a $11.6b inflow of debt and a $2.0b inflow of equity.
Direct investment in Australia recorded an inflow of $0.05b in the June quarter 2007, a decrease of $9.1b on the revised March quarter 2007 inflow of $9.2b. Australia's direct investment abroad recorded an outflow of $4.9b, a decrease of $8.2b on the previous quarter's revised outflow of $13.1b. In net terms, direct investment recorded an outflow of $4.9b, an increase of $1.0b on the March 2007 outflow of $3.9b.
Portfolio investment recorded a net inflow of $21.0b, a decrease of $3.0b on the net inflow of $24.0b in March quarter 2007.
Other investment recorded a net inflow of $7.0b, a turnaround of $9.6b on the net outflow of $2.6b in the previous quarter.
Reserve assets recorded a net outflow of $10.1b, an increase of $8.5b on the previous quarter's net outflow of $1.6b.
INTERNATIONAL INVESTMENT POSITION
INTERNATIONAL INVESTMENT
Australia's net international investment position at 30 June 2007 was a net foreign liability of $642.4b, up $15.7b (2%) on 31 March 2007. The increase consisted of:
- net transactions of $13.6b
- exchange rate changes of $8.2b
- price changes of -$6.0b
- other adjustments of -$0.1b.
During the June quarter 2007 the level of net foreign debt increased by $8.9b (2%) to a liability of $544.1b. Increase in net debt raisings of $11.6b and price changes of $1.2b were partially offset by exchange rate changes of -$3.9b and other adjustments of -$0.1b.
During the June quarter 2007 net foreign equity rose $6.8b (7%) to close at a liability of $98.4b. The contributors to this increase were exchange rate changes of $12.0b, net transactions of $2.0b and price changes of -$7.2b.
FINANCIAL YEAR: 2006-2007 SITUATION
BALANCE OF PAYMENTS
In original terms, the balance on current account for 2006-07 was a deficit of $59.2b, a 10% increase on the deficit of $53.9b recorded for 2005-06. The balance on goods and services deficit was $12.0b, a decrease of $2.5b on the deficit of $14.5b recorded in 2005-06. Goods exports increased $15.2b or 10% (due to increases in both volumes and prices) and goods imports increased $13.7b or 8% (due largely to an increase in volumes).
The 2006-07 services surplus of $1.8b was an increase of $1.0b on the surplus of $0.8b in 2005-06.
The 2006-07 net income deficit rose $7.8b (20%), with an increase in income credits of $7.9b (32%) and an increase in income debits of $15.7b (25%).
The balance on financial account recorded a net inflow of $57.2b, with a net inflow on debt of $57.7b and a net outflow on equity of $0.5b. This result was up $3.9b on the net inflow recorded for the previous year as a result of:
- an increase of $14.5b on the net outflow on reserve assets
- a decrease of $14.1b on the net outflow on direct investment
- an increase of $8.4b on the net inflow on portfolio investment
- a turnaround of $7.6b to a net outflow on other investment
- a turnaround of $3.5b to a net inflow on financial derivatives.
INTERNATIONAL INVESTMENT POSITION
Australia's net international investment position as at 30 June 2007 was a net foreign liability of $642.4b. This was up $89.9b (16%) on the position a year earlier as a result of:
- net transactions of $57.2b
- price changes of $17.6b
- exchange rate changes of $14.4b
- other adjustments of $0.7b.
During 2006-07, the level of net foreign equity increased to a liability of $98.4b, up $46.6b (90%) on the previous year with price changes of $18.2b, and exchange rate changes of $29.4b, partially offset by other adjustments of -$0.5b and transactions of -$0.5b
Net foreign debt rose to $544.1b, up $43.3b (9%) on the previous year, with transactions of $57.7b and other adjustments of $1.2b. These were partially offset by exchange rate changes of -$15.0b and price changes of -$0.6b.
At 30 June 2007, the ratio of Australia's net international investment position to GDP using the latest available GDP figure (for the year ended 31 March 2007 using current prices) was 62.7%. This compares with 57.2% one year ago and 53.2% one decade ago.
 Print Page
 Print All