REGIONAL OVERSEAS MIGRATION
Regional overseas migration is the movement of people to or from Australia's regions through immigration or emigration. Net regional overseas migration is the net gain or loss of population through this movement.
The following commentary analyses regional overseas migration estimates for 2016-17 as released in Regional Population Growth, Australia, 2016-17 (cat. no. 3218.0). It discusses data at the following geographic levels as defined in the Australian Statistical Geography Standard: Greater Capital City Statistical Area and Statistical Area Level 4 (SA4).
CAPITAL CITIES
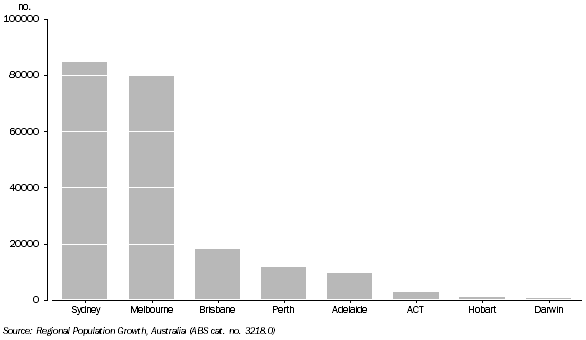
All capital cities recorded net gains from overseas migration in 2016-17. Sydney and Melbourne had the highest net gains of all Greater Capital Cities by far. Sydney gained a net of 84,700 overseas migrants while Melbourne added 80,000. Brisbane had the next highest net gain from overseas migration at 18,000, less than one quarter of that in Sydney and Melbourne.
Darwin had the smallest net overseas migration gain with 700 people, followed by Hobart (840) and the Australian Capital Territory (2,800).
4.1 NET REGIONAL OVERSEAS MIGRATION, GREATER CAPITAL CITY STATISTICAL AREAS - 2016-17

OTHER REGIONS
Australia's two most populous capital cities - Sydney and Melbourne - contained the ten SA4s with the highest net gains through regional overseas migration in 2016-17. Melbourne - Inner had the largest net gain of all, at 18,900, followed by Melbourne - South East (15,900). In Sydney, the SA4s which added the most residents through net overseas migration were Sydney - Parramatta (13,400) and Sydney - Inner South West (13,300).
In contrast, the SA4s with the smallest net gains from overseas migration were all outside of the capital cities, many covering rural and remote regions of Australia. South East in Tasmania recorded the smallest net gain (60), followed by Barossa - Yorke - Mid North in South Australia (130), West and North West (140), also in Tasmania.
The following table shows the SA4s with the highest and lowest net gains, broken down into arrivals and departures.
4.2 HIGHEST AND LOWEST NET OVERSEAS MIGRATION GAINS, SA4 - 2016-17 |
|
 |  | Arrivals | Departures | Net |
| SA4 | State | no. | no. | no. |
|
HIGHEST NET MIGRATION GAINS
|
| Melbourne - Inner | Victoria | 46 070 | 27 147 | 18 923 |
| Melbourne - South East | Victoria | 26 813 | 10 895 | 15 918 |
| Sydney - Parramatta | New South Wales | 23 391 | 9 951 | 13 440 |
| Sydney - Inner South West | New South Wales | 23 038 | 9 723 | 13 315 |
| Melbourne - West | Victoria | 20 325 | 7 569 | 12 756 |
LOWEST NET MIGRATION GAINS
|
| South East | Tasmania | 160 | 101 | 59 |
| Barossa - Yorke - Mid North | South Australia | 266 | 134 | 132 |
| West and North West | Tasmania | 384 | 240 | 144 |
| South Australia - Outback | South Australia | 301 | 151 | 150 |
| Queensland - Outback | Queensland | 528 | 360 | 168 |
|
 Print Page
 Print All
 Quality Declaration